By Jim Cline and Kate Kremer
 This is the second part of our 2023 wage series. In this article, we look at recent contract settlements and examine how those trends vary from previous years.
Washington Public Sector Labor Negotiations Blog
Trends and Developments Concerning Washington Public Labor Contracts
By Jim Cline and Kate Kremer
This is the second part of our 2023 wage series. In this article, we look at recent contract settlements and examine how those trends vary from previous years.

By Jim Cline
Public safety contract negotiations and enforcement has been particularly challenging over the past few years. For the tumultuous 2020 to the legislative (over)reaction in 2021, to the recent wild swings in inflations, this period has made it especially clear for the need of labor reps to stay current and fully informed on developments.
By Jim Cline and Kate Kremer
![]() Today’s CPI article is the first in our exhaustive year end contract settlement and wage rankings. Clients and Premium Website Subscribers can get an advance preview of the data off the Premium website.
Today’s CPI article is the first in our exhaustive year end contract settlement and wage rankings. Clients and Premium Website Subscribers can get an advance preview of the data off the Premium website.
By Jim Cline and Kate Kremer
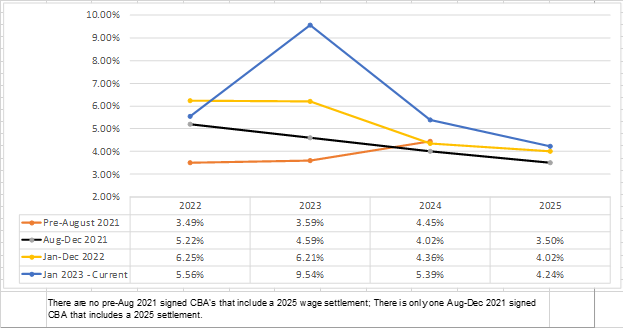
 We have been closely tracking and reporting on inflation trends. The recent “ups and downs” (in inflation has implications for the broader economy but it has some rather direct impacts on our contract negotiations.
By Jim Cline and Kate Kremer
 In the past two newsletter issues, we reported on and discussed the annual OFM population numbers. As indicated, all the details of those numbers are posted on the Cline and Associates Premium Website. While the Cline and Associates Database tracks a wide range of demographic factors, Population remains the most important factor for the selection of negotiation “comparables.”
By Jim Cline and Kate Kremer
 In our last newsletter, we announced the release of the 2023 OFM Population Report. In this article, we discuss some of the highlights from the OFM data.
By Jim Cline and Kate Kremer
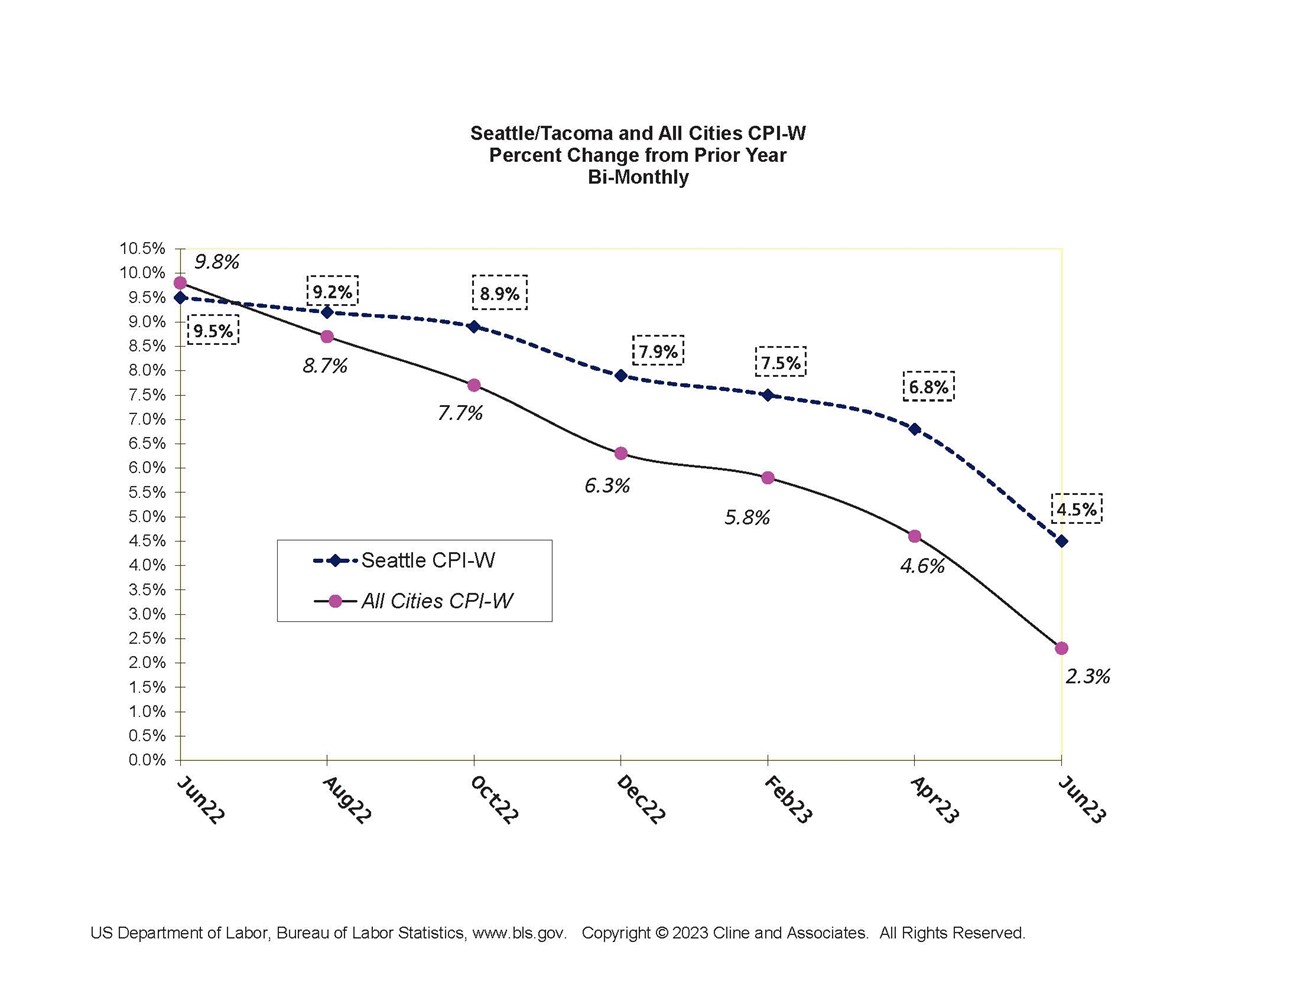
In the last newsletter, we reported on the Bureau of Labor Statistics release of the June CPI numbers. As was noted, over the past 4 months the CPI has slid dramatically, although the Seattle numbers remain high by historic standards and substantially outpace the national CPI indices. The June CPI-W numbers are reflected in this graph:

By Jim Cline and Kate Kremer
 City and County April 1 annual population estimates are released the beginning of July by the Office of Financial Management Forecasting and Research Division.

By Jim Cline and Kate Kremer
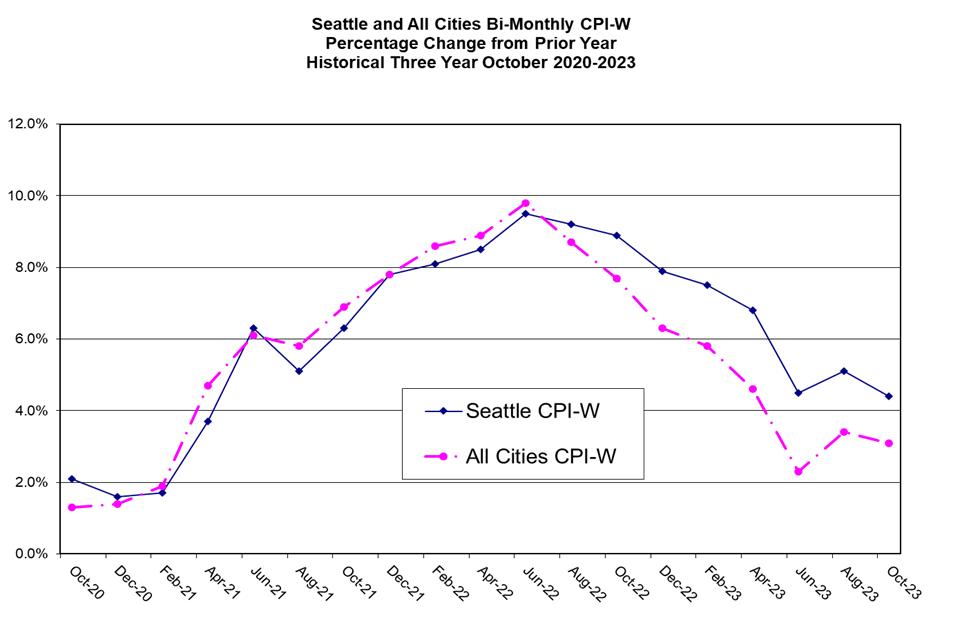
 The Bureau of Labor Statistics released the June CPI Numbers on July 12. Both the Seattle and All Cities CPI numbers dropped significantly, although the Seatle numbers continue to notably outpace the national indices. This graph shows the relative numbers over the past 12 months and to date for the “W” index:

By Jim Cline
In our past two newsletters, we’ve discussed the continuation of higher-than-expected inflation. Those articles identified the prediction by economists earlier this year for the mid-year 2023 national inflation to subside to 3.6% and our doubts that those predictions will materialize. We are now expecting the June CPI numbers to be closer to 5% nationally and higher for the Seattle indices.

