By Jim Cline
 In Monday’s newsletter, we reported on the last All-Cities and Seattle CPI from February. That report showed that the Seattle indices, which had been running a percentage point or two over the All-Cities number are now coinciding with the All-Cities numbers and actually a fraction of a percent lower. This raises a recurring question on the differences between these indices and the pros and cons of each.
First, there needs to be an understating of the scope of where these numbers come from. The Seattle indices (“U” and “W”) do not cover simply costs within the City of Seattle but cover use sampling from all of King, Snohomish, and Pierce counties. BLS used to include adjacent urban Counties in the Seattle CMSA region like Kitsap and Thurston but eventually narrowed the geographic scope of this index.
Still, because those adjacent areas likely have their cost of living impacted more by Seattle Metro trends than national trends, it is common to use the Seatle numbers in negotiating contracts throughout Western Washington and even sometimes in Eastern Washington. Housing prices and other components of the cost of living throughout the State are much more likely to be influenced by what’s happening in the Seattle area than what is occurring in the Midwest or East Coast. And when you are using comparables that are located inside the Seattle Metro area, it’s likely that you are looking at the trends and expected trends for those contracts with a goal of keeping pace with those trends.
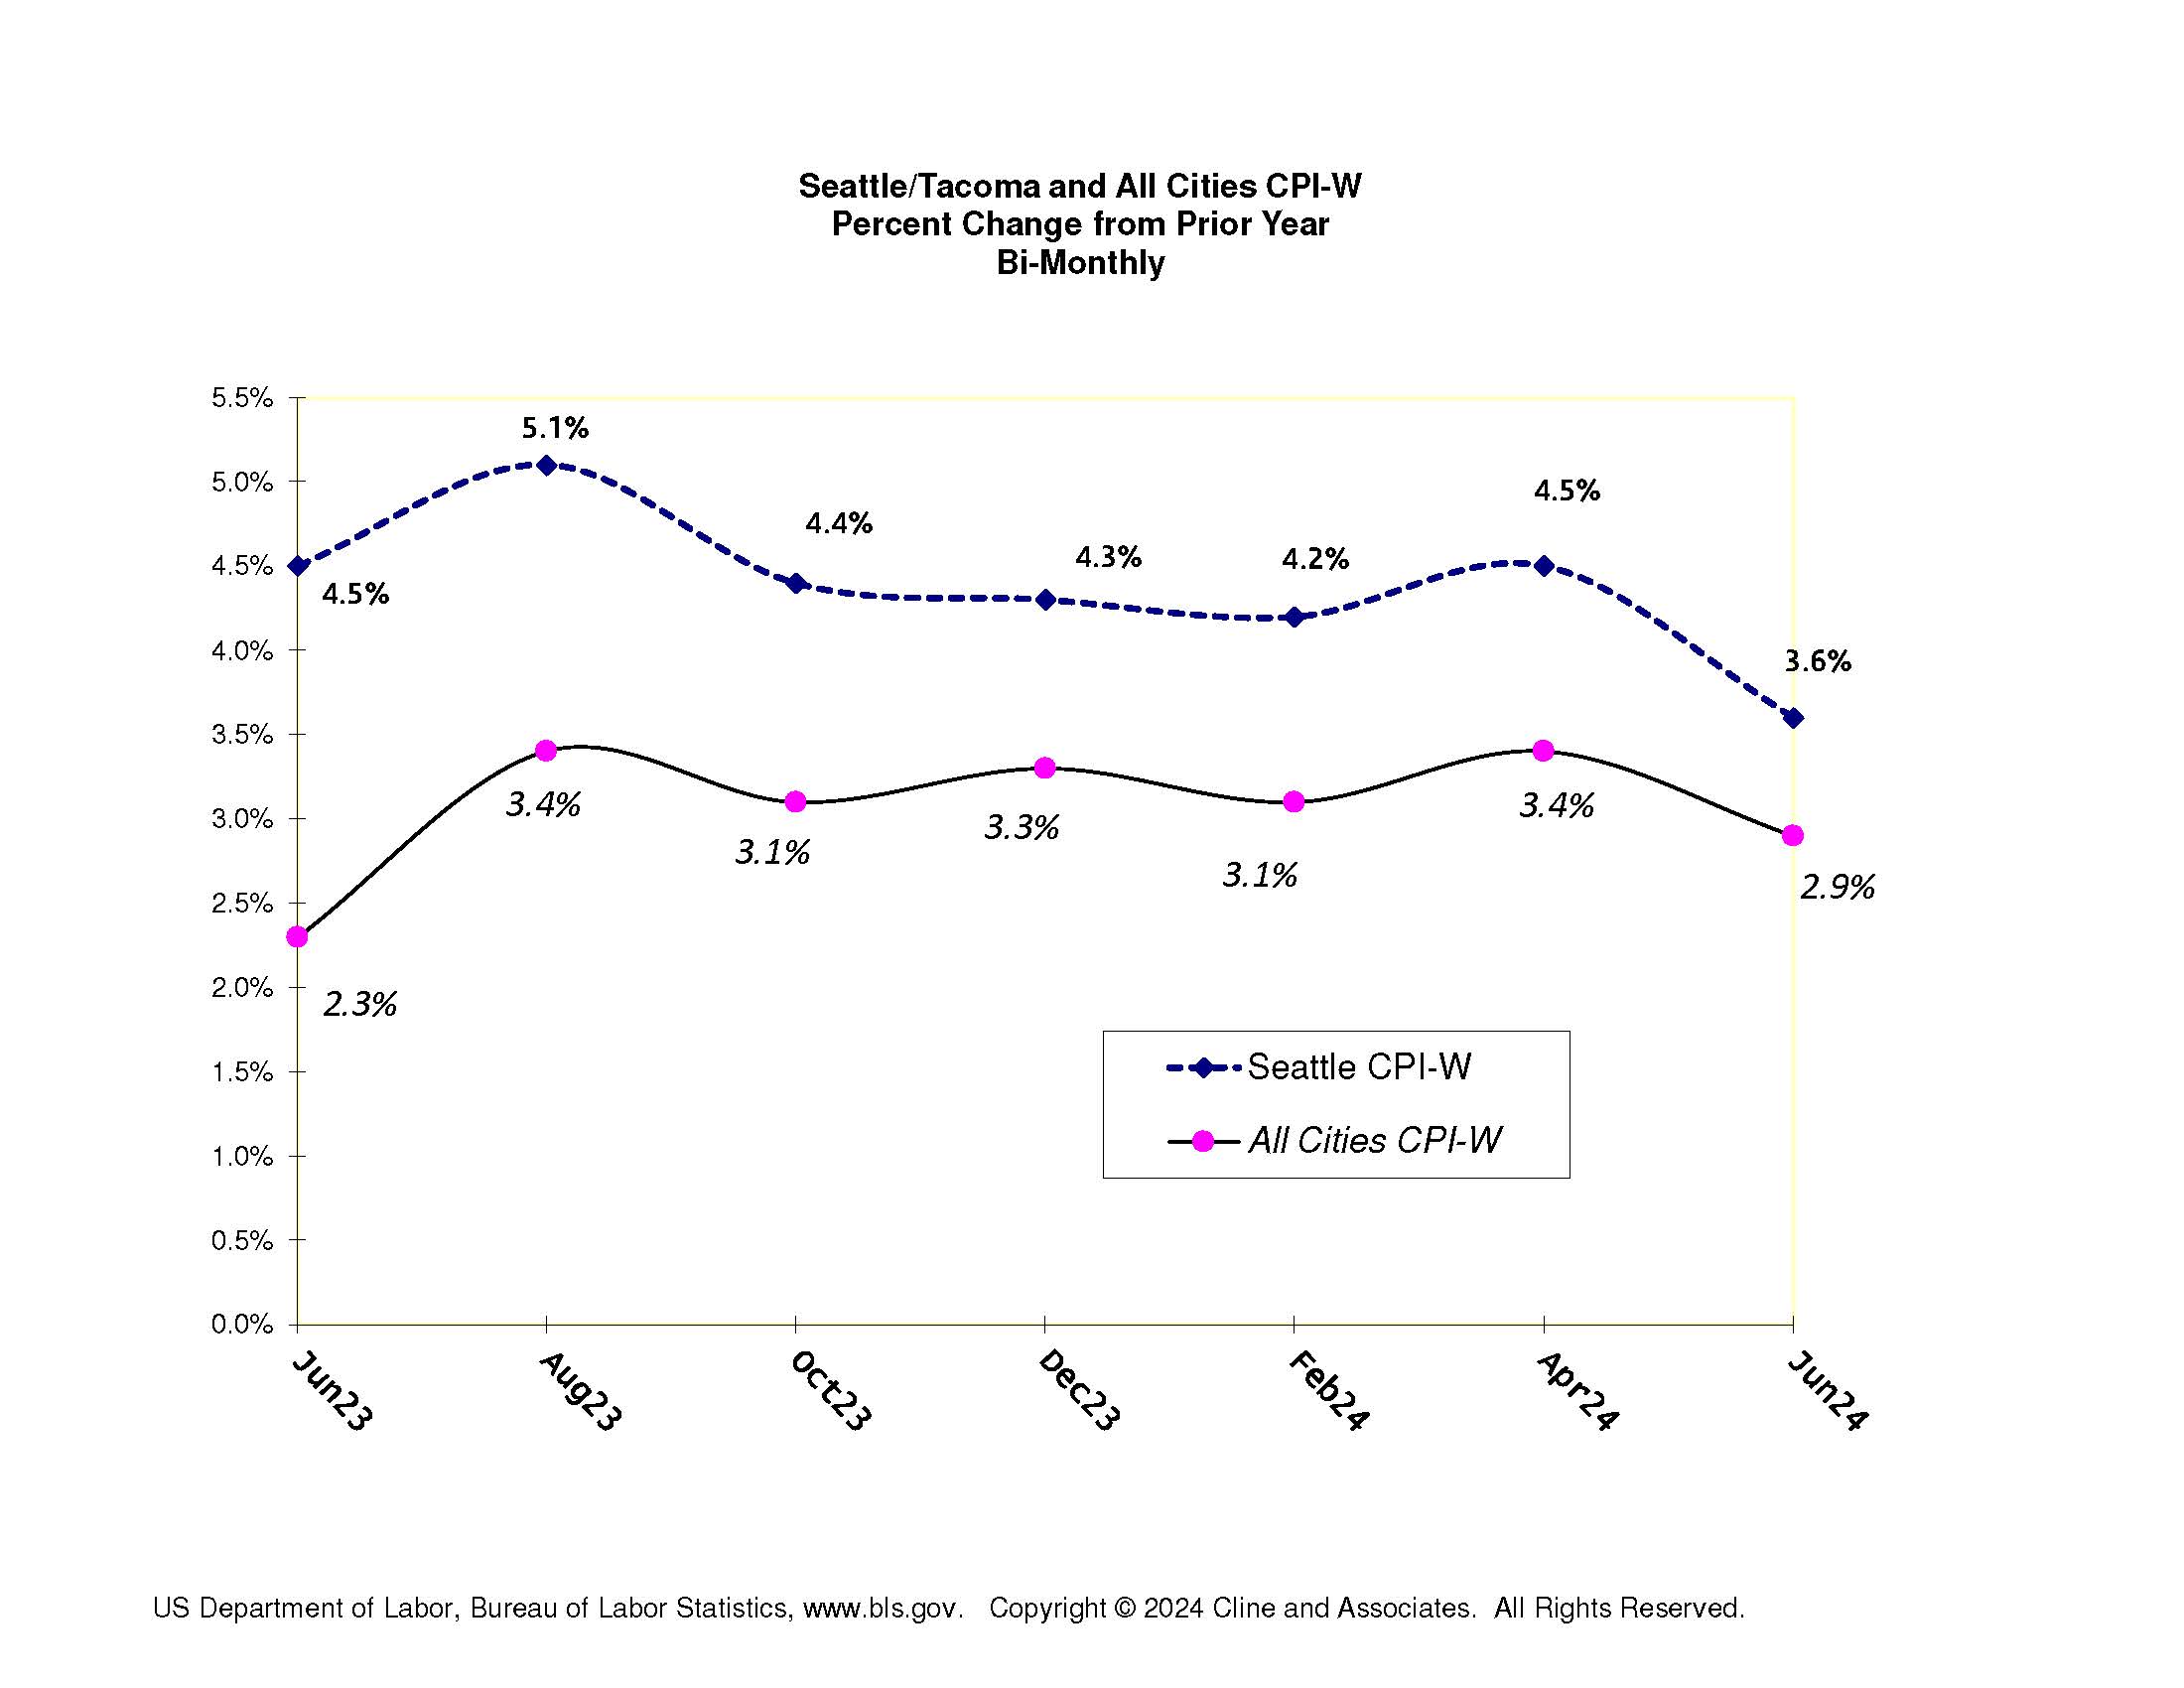
We have written on many occasions that there’s been a long term tendency of the Seattle indices to outpace the national indices. What’s been noteworthy recently is how much that has occurred. Two years ago, the All-Cities CPI was 2.3% while the Seattle number was 4.5%. While it is not uncommon for the Seattle numbers to outpace the national numbers by a fraction of a percent, that 2.3-point difference is remarkable and, as we expected, not likely to be long sustained. By last June the gap (had closed to a percentage (4.3% versus 3.3%).
Since that time the Seattle indices have continued to subside. As we explained in December, the large gap that had existed between the Seattle and national numbers is closing. And this month, as indicated above, the Seattle numbers are slightly lower. And as our report on the February numbers show, the gap has now disappeared.
That doesn’t mean that the Seattle indices, at least over time, won’t ride a slight amount above the national numbers. As long as the Seattle regional economy continues to perform strong the related inflation pressures, especially on housing costs, will continue. We have said repeatedly that if you were to tie your contract to a particular index, the Seattle index is a better bet in the long run than the All Cities, and we continue to make that recommendation for now.
 In our
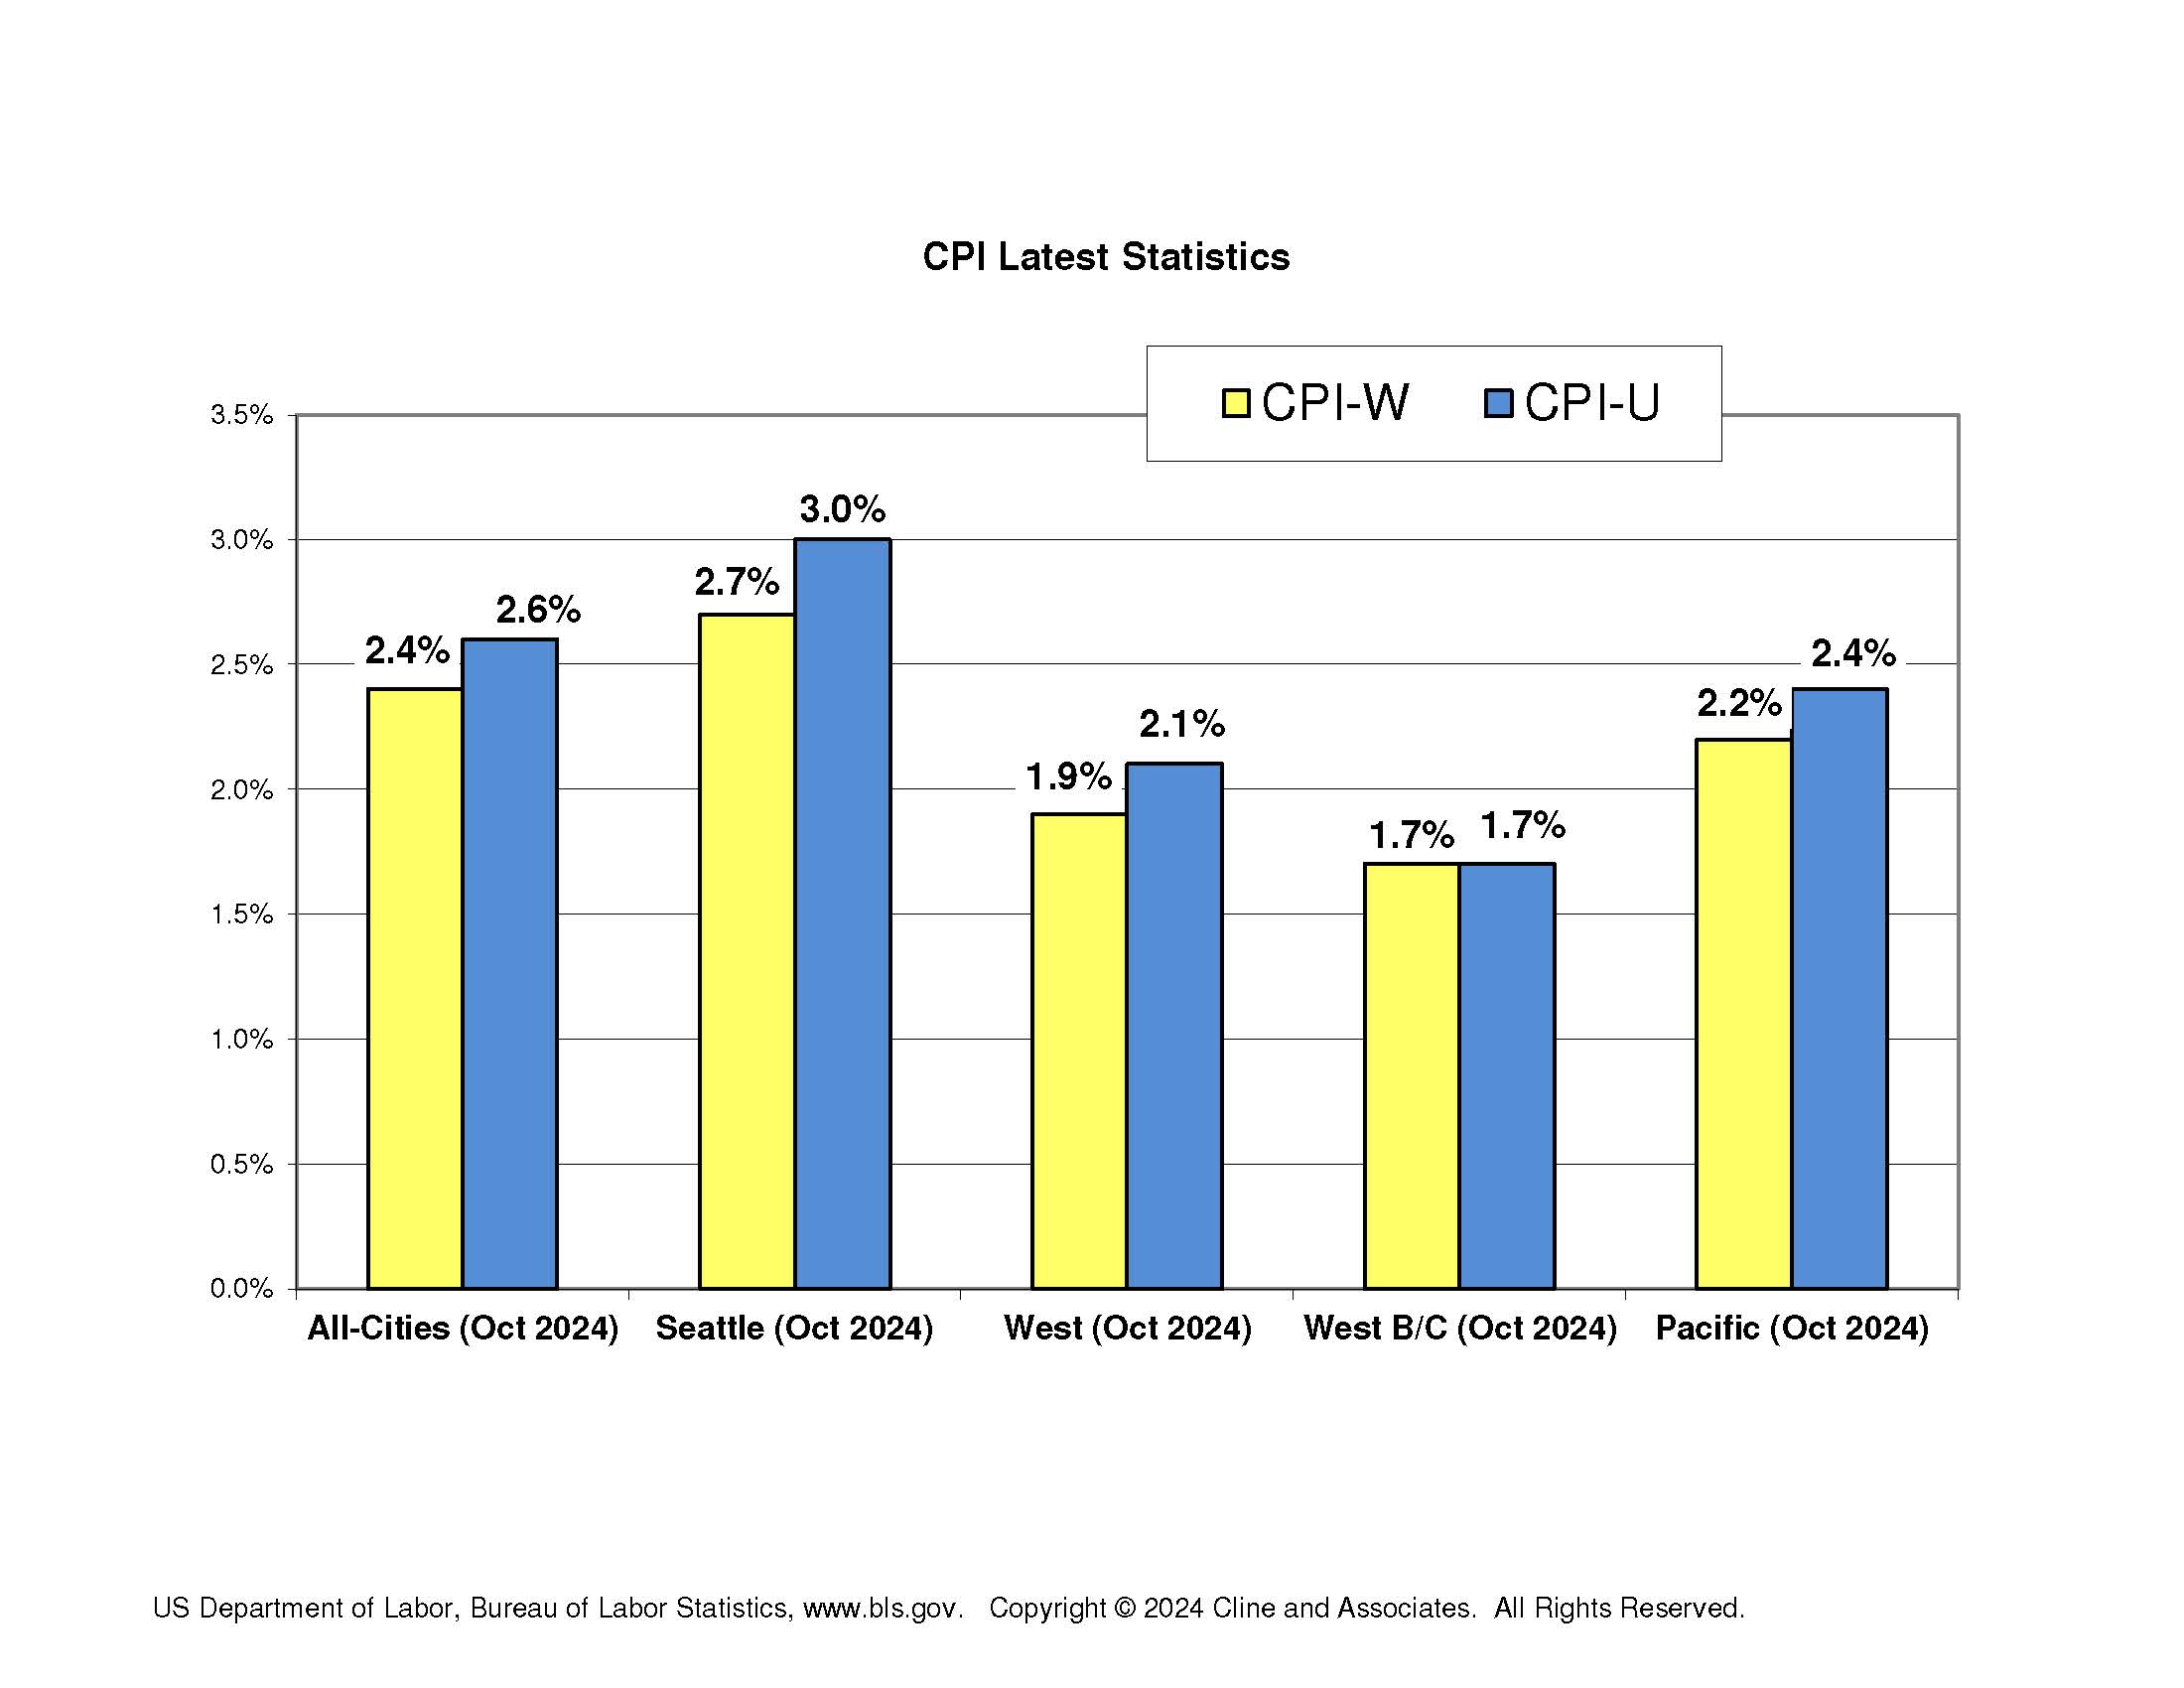
  The Bureau of Labor Statistics released their
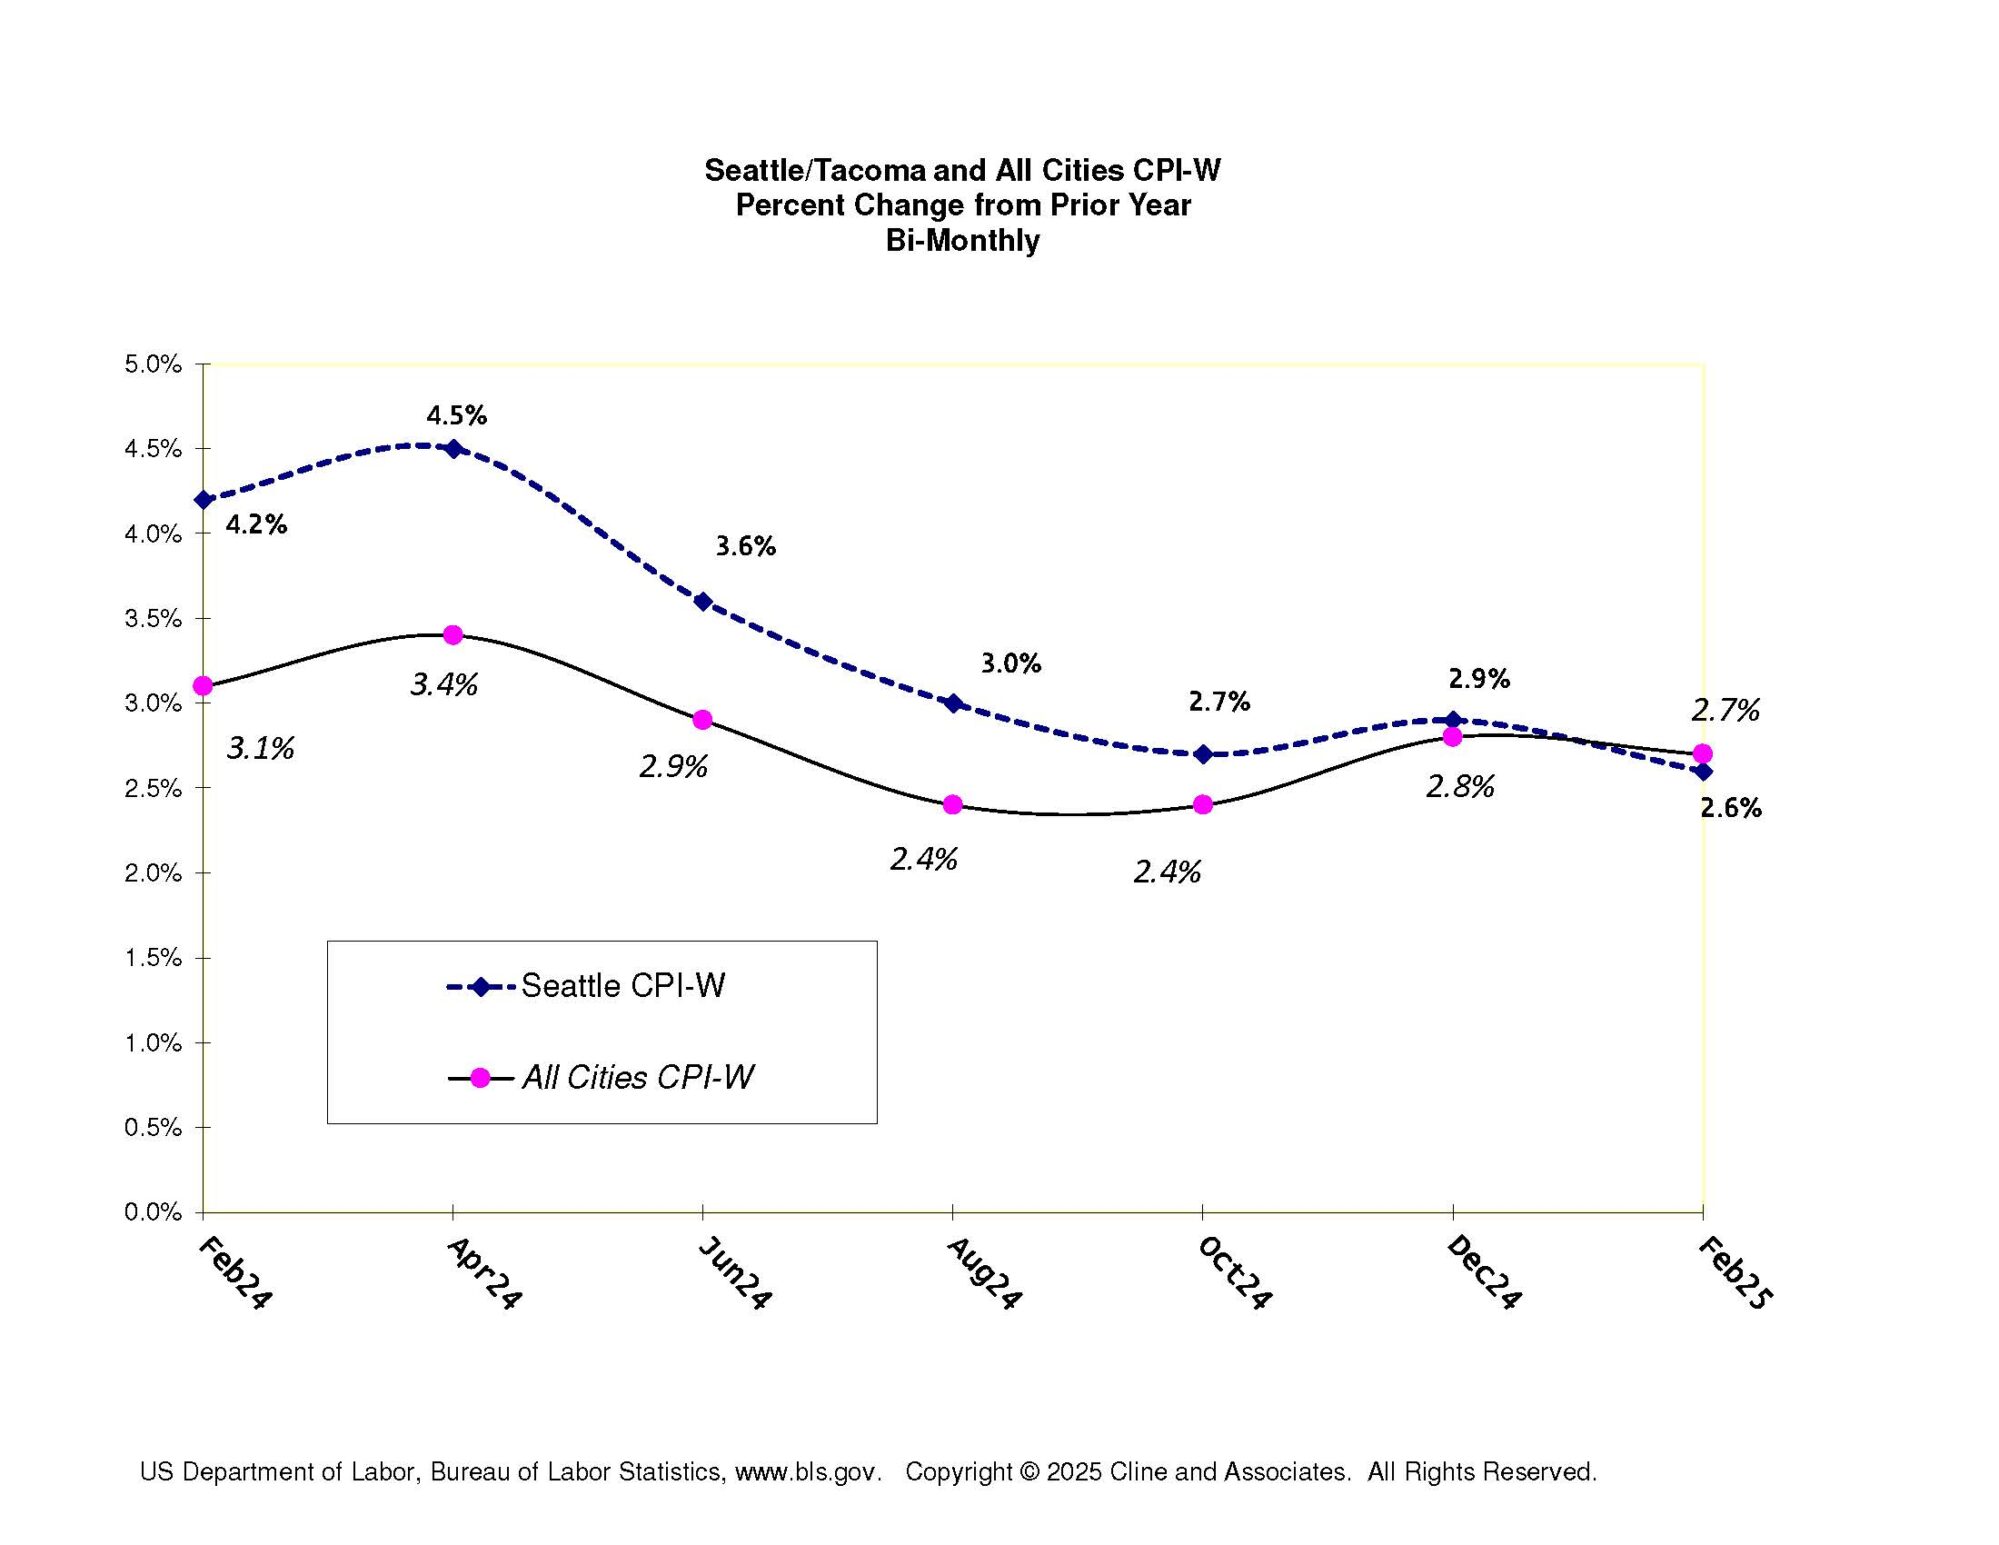
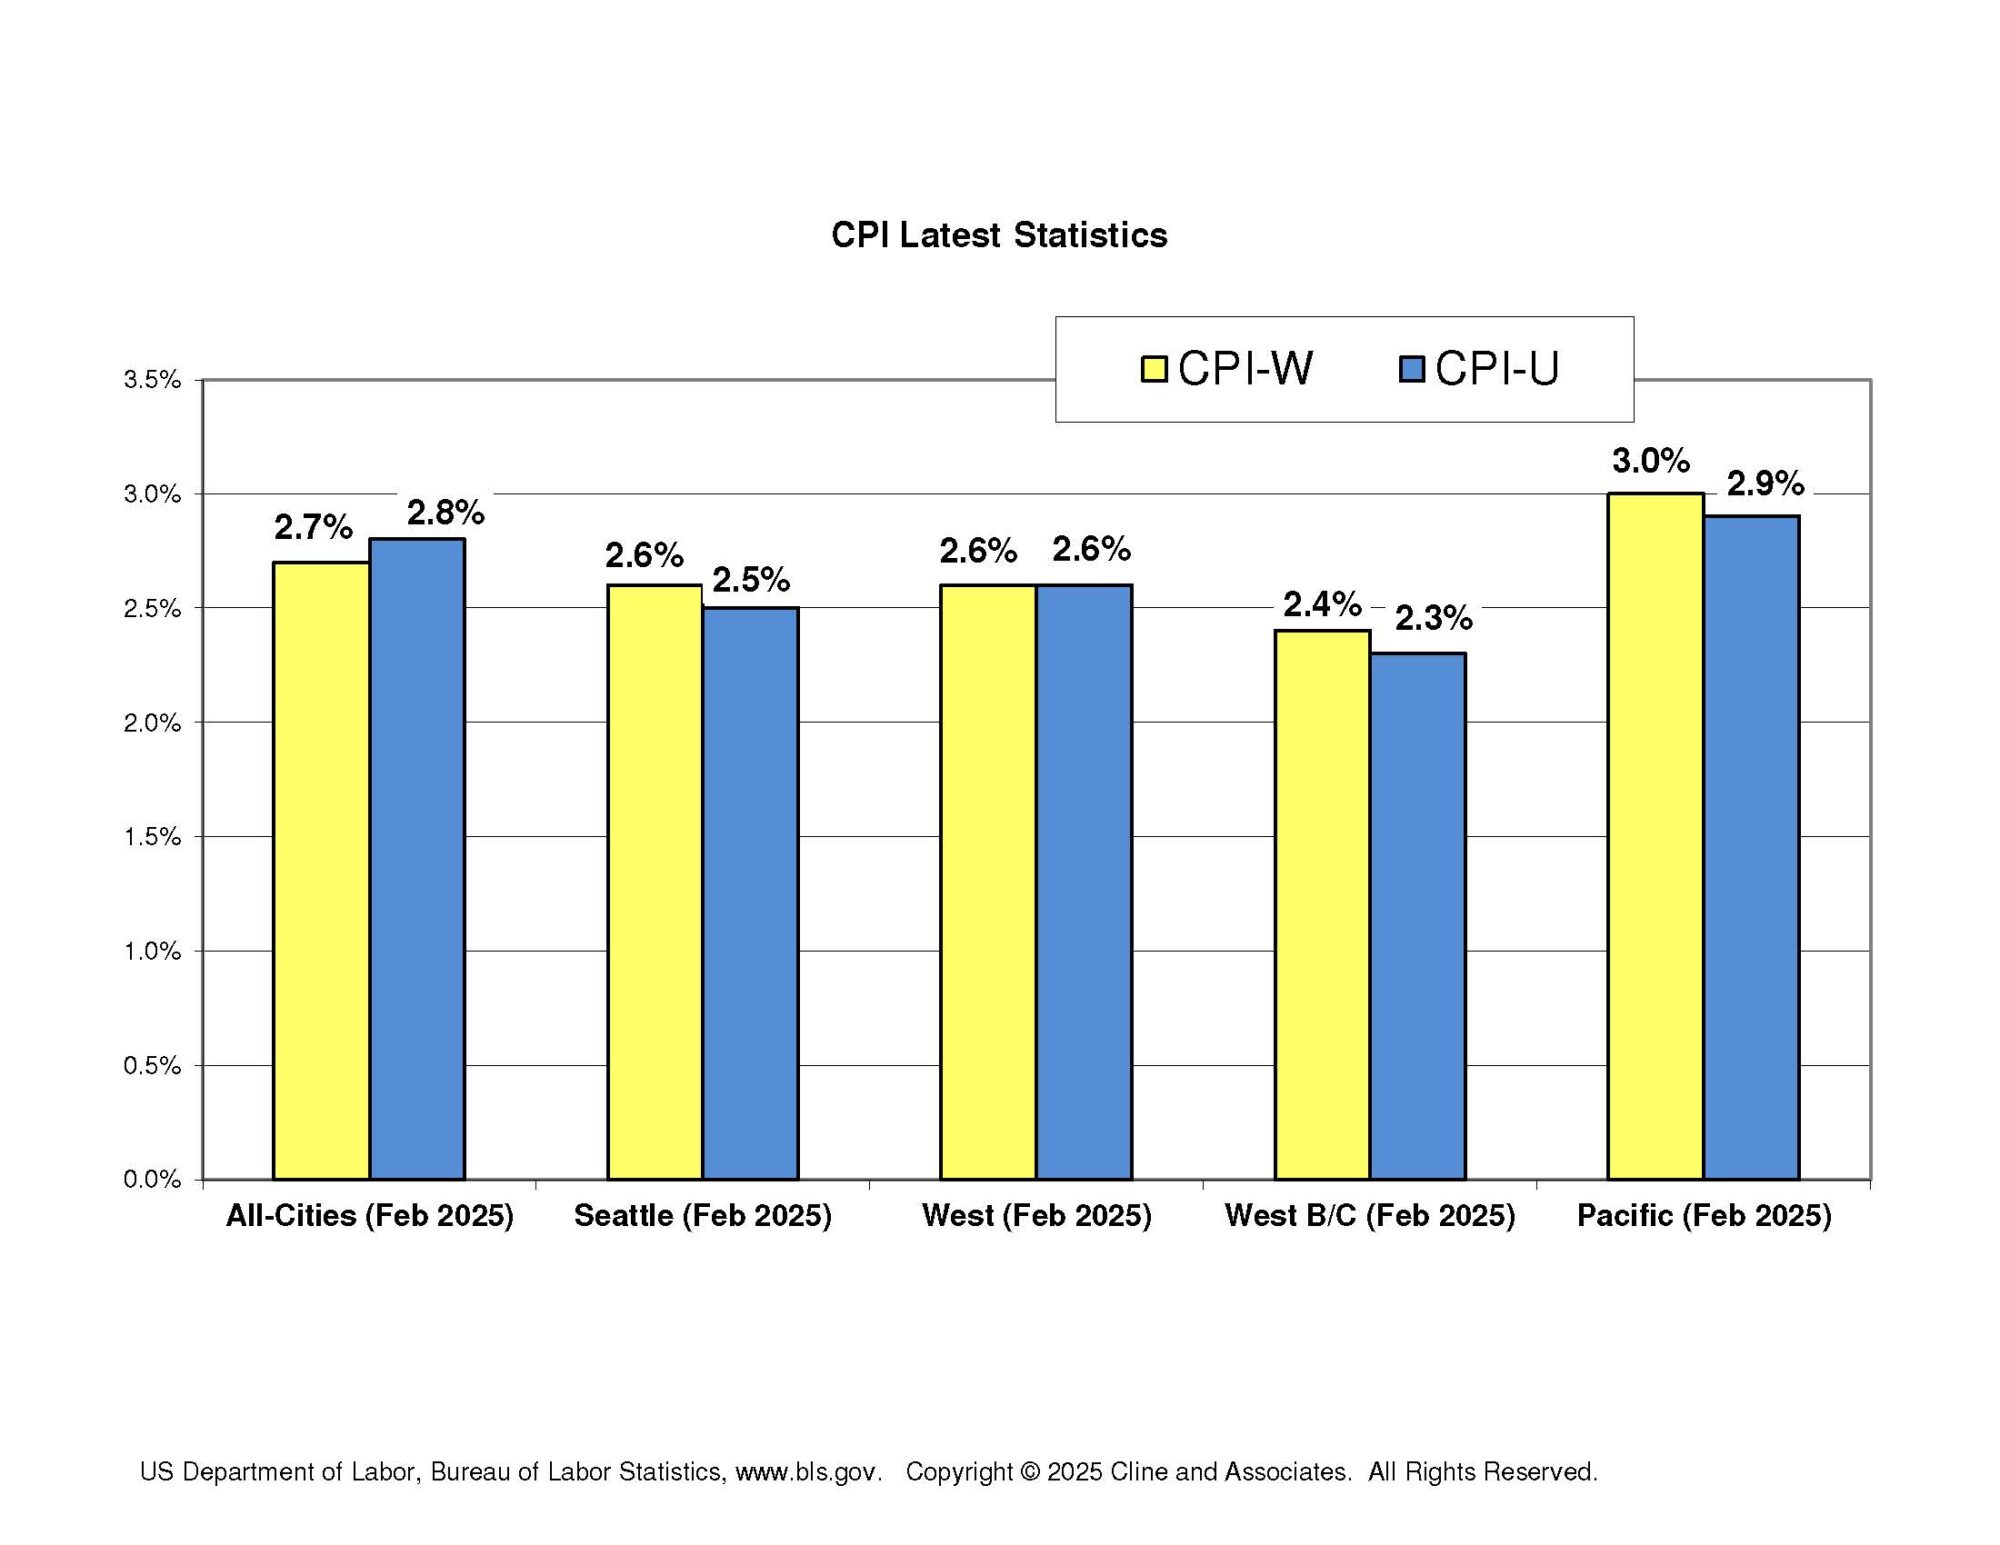
 The latest CPI data shows a continued easing in inflation. The period of higher inflation of the past few years seems to be ending at least for now. And the large gap that had existed between the City and All Cities CPI also seems to be closing.
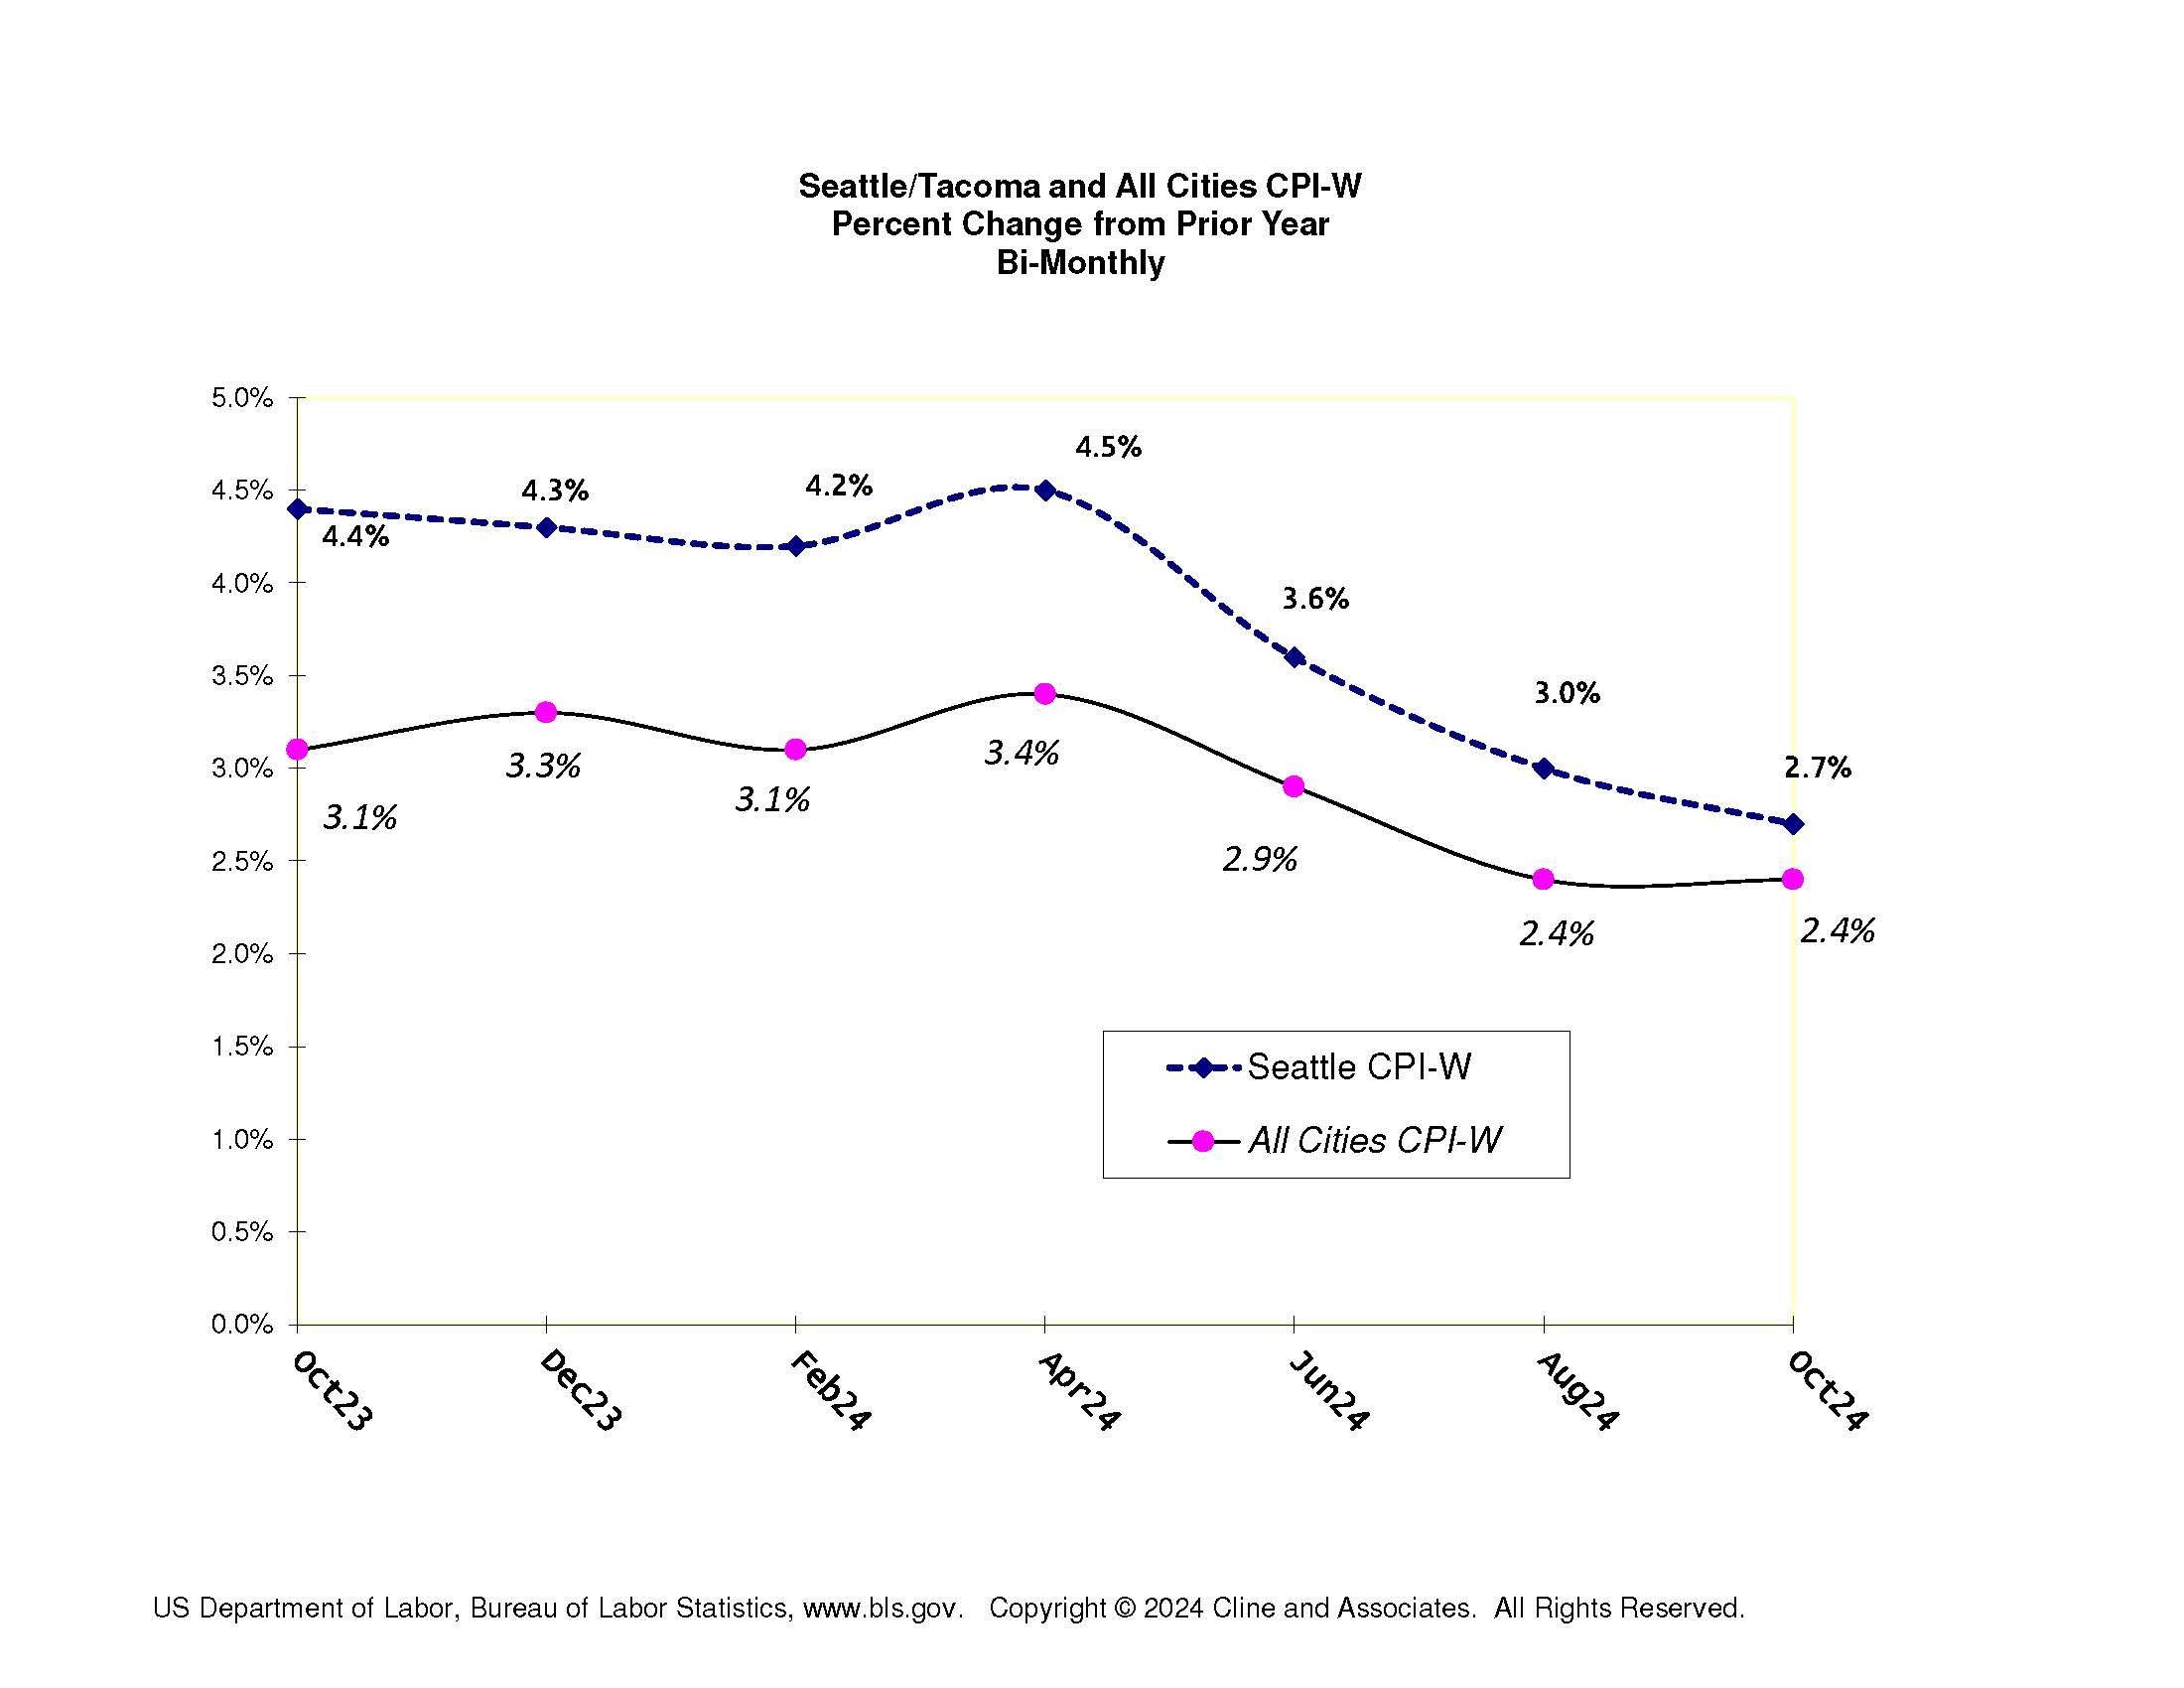


 Long overdue good news for Washington Dispatchers. The Governor has signed
