By Jim Cline and Kate Kremer
 In the last two newsletters, we reported on the surprisingly sharp rise in inflation and how that development and the uncertainty in future inflation predictions would have a potentially large impact on wage negotiations. The jump in inflation suggests rising settlements but other developments likewise support our prediction that settlements for 2022 (and 2023) will be heading up.
“First Half” Sales Tax Distribution Numbers Are Rising
Since the beginning of the pandemic, we have been analyzing the Sales Tax distributions to cities and counties to understand the impacts of the pandemic on municipal funding. In our December 2020 blog, “State Economic Forecast and Sales Tax Revenues Rebound” we reviewed the data and offered a hopeful assessment. We now have the First half of 2021 Sales tax numbers that give us a window into 2021 in light of the mostly pre-pandemic first quarter of 2020.
Local government revenues have bounced back and then some, first by the rebounding sales tax and other revenues, and second by the infusion of American Rescue Plan (ARP) money (discussed below) which for many has proven to be a bit of a windfall. Locate your employer’s latest sales tax yield on the Cline and Associates Premium Website.
In the first quarter of 2021, 267 out of 320 cities, counties, and towns (83%) had a positive change in local tax distributions over the First Quarter 2020 numbers. Some small cities did very well with Tieton, Goldendale, and Normandy Park receiving over 35% more in the first quarter of 2021 than in the first quarter of 2020. Some small counties did well with Wahkiakum, Okanogan, Garfield, San Juan, and Ferry Counties receiving over 25% more than in the first quarter of 2020.
But some cities and counties, large and small, saw decreases in this time period. Pend Orielle, Lewis, Klickitat, and Columbia all saw less Sales Tax Distributions in the first quarter of 2021 than in the first quarter of 2020. Seattle and Bellevue were among the large cities with a decrease in distributions. This data is available for all Washington cities and counties on our premium website 2020-2021 First Quarter Sales Tax Distributions compared to the Prior Year report so you can review this financial indicator for your municipality. The Second Quarter Sales Tax Distributions compared to the Prior Year report is also available.
This positive trend in sales tax distribution has continued into the second quarter and is highlighted in our analysis of the January to June first half numbers. The numbers for 2020 were unusually low so in order to get a good comparison for where we are in 2021 we went back to the 2019 numbers. A comparison of the First Half 2019 to the First Half 2021 Sales Tax Distribution gives us a sense of the current fiscal situation for Washington municipalities. 285 out of 320 municipalities (89%) have 2021 increases over 2019 first half sales tax distribution numbers.
The trends that we saw in the first quarter numbers held up with some smaller counties and cities seeing over 35% more sales tax distributions in the first half of 2021 than in the first half of 2019. And a few larger cities, most notably Seattle, still having slightly less in the first half of 2021 than in the first half of 2019. SeaTac, Tukwila and Des Moines also saw negative numbers in this comparison.
The variations in local government sales tax revenues have been largely attributed to what’s been called the “Amazon Factor.” Cities like Seattle and Bellevue and others that hosted large retail bases had stagnated retails sales from their malls and other “brick and mortar” outlets. (Seattle’s drop was also aggravated by some rather fundamental mismanagement by its current elected officials but that’s a much larger story.)
Cities that traditionally had little retail, such as “bedroom communities,” managed to see an increase in sales tax revenue even though their own retail stores may have suffered. How? Because revisions in sales tax law require the local government share of the tax be directed to the “point of sale.” Consumers buying online from their living rooms are adding to their hometown tax revenues.
American Rescue Plan Funds Come to the Aid of Municipalities
But this is not the end of the positive news because the federal American Rescue Plan (ARP) was passed and has substantial funds available for municipalities. These funds will more than offset decreased Sales Tax distributions for most cities and counties. To provide some relative perspective on the magnitude of these new monies, we have placed these figures next to the 2019 General Fund revenues. The General Fund Revenues and ARP Fund report is also available on our premium website. General Fund Revenues are a good indicator for municipal financial resources however there is a lag in data. The 2020 numbers are not yet available. The ARP allocations compared to the 2020 annual Sales Tax Distributions table is also an insightful comparison as the Sales Tax distribution numbers are more current.
For example, even Columbia County, which as we indicated took a huge 48% decrease in Sales Tax Distributions in 2020, more than makes up for this entire loss in the ARP funds. Although we acknowledge that the ARP funding will be distributed over two years, it can provide needed funding to the minority of Washington municipalities that were hard hit by the pandemic economic situation. Follow the links to the Premium Website to review your employer’s ARP allocations.
In spite of the pandemic (and perhaps, ironically, because of it), municipalities have funds and should be able to come to the table with reasonable wage and benefit increases.
Washington State Economic and Revenue Forecasts for the Future Look Bright
The Washington Economic and Revenue Forecast Council (ERFC) was established as an independent agency by the legislature in 1984 and it provides monthly, quarterly, and annual reports and forecasts. This data is utilized by the State in budget planning. Current statistics such as the local sales tax distributions give us a sense as to where we have been, the ERFC helps us anticipate what might lay ahead, which is crucial for the wage and benefit contract negotiations.
Forecasts of any kind in a worldwide pandemic are difficult. The economic and revenue forecast in June 2020 was grim and Washington municipalities got ready to take a hit. But the reality did not prove as dire for Washington as for other States. The New York Times map of the change in state revenues from April – December 2020 over the same period in 2019 shows that Washington was among the 22 states that brought in positive year-over-year growth in tax revenue with 2.5% more than the prior year.Washington State had a favorable mix of industries that insulated it from sustained decreases in revenues.
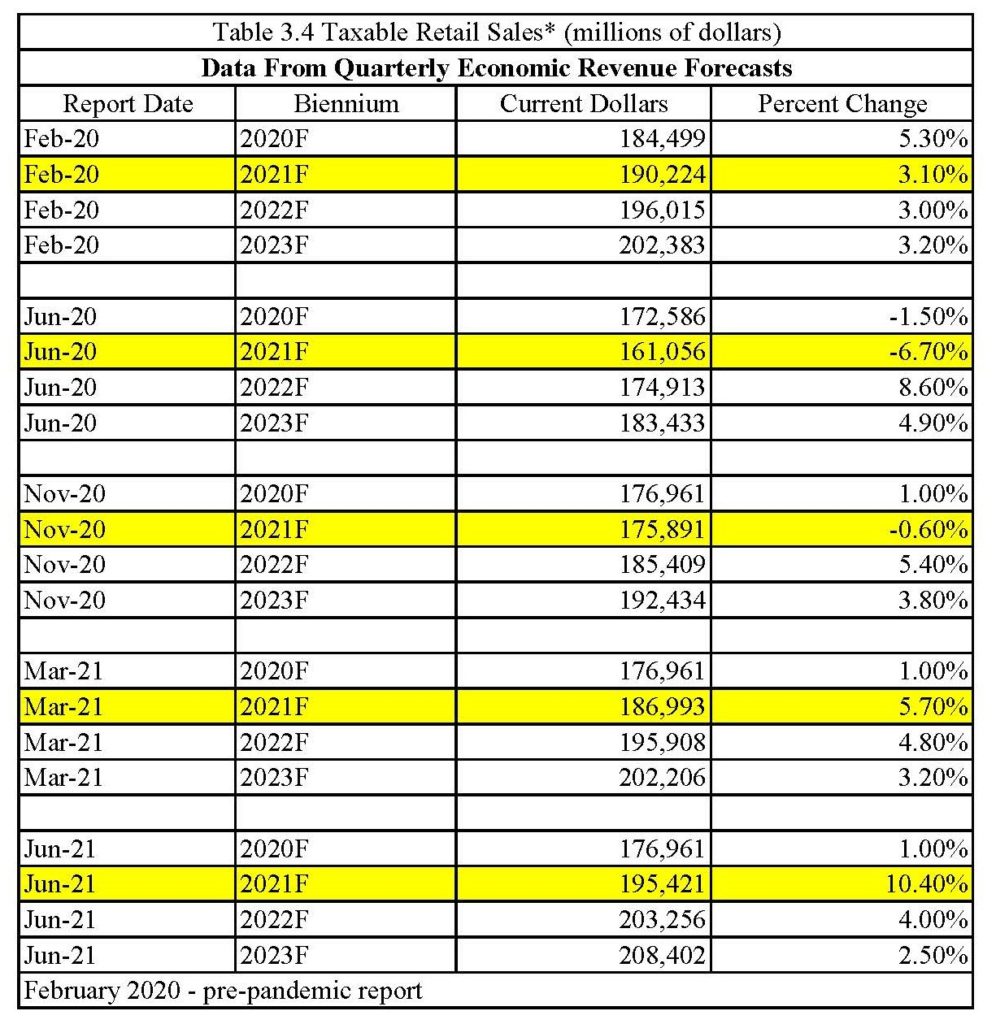
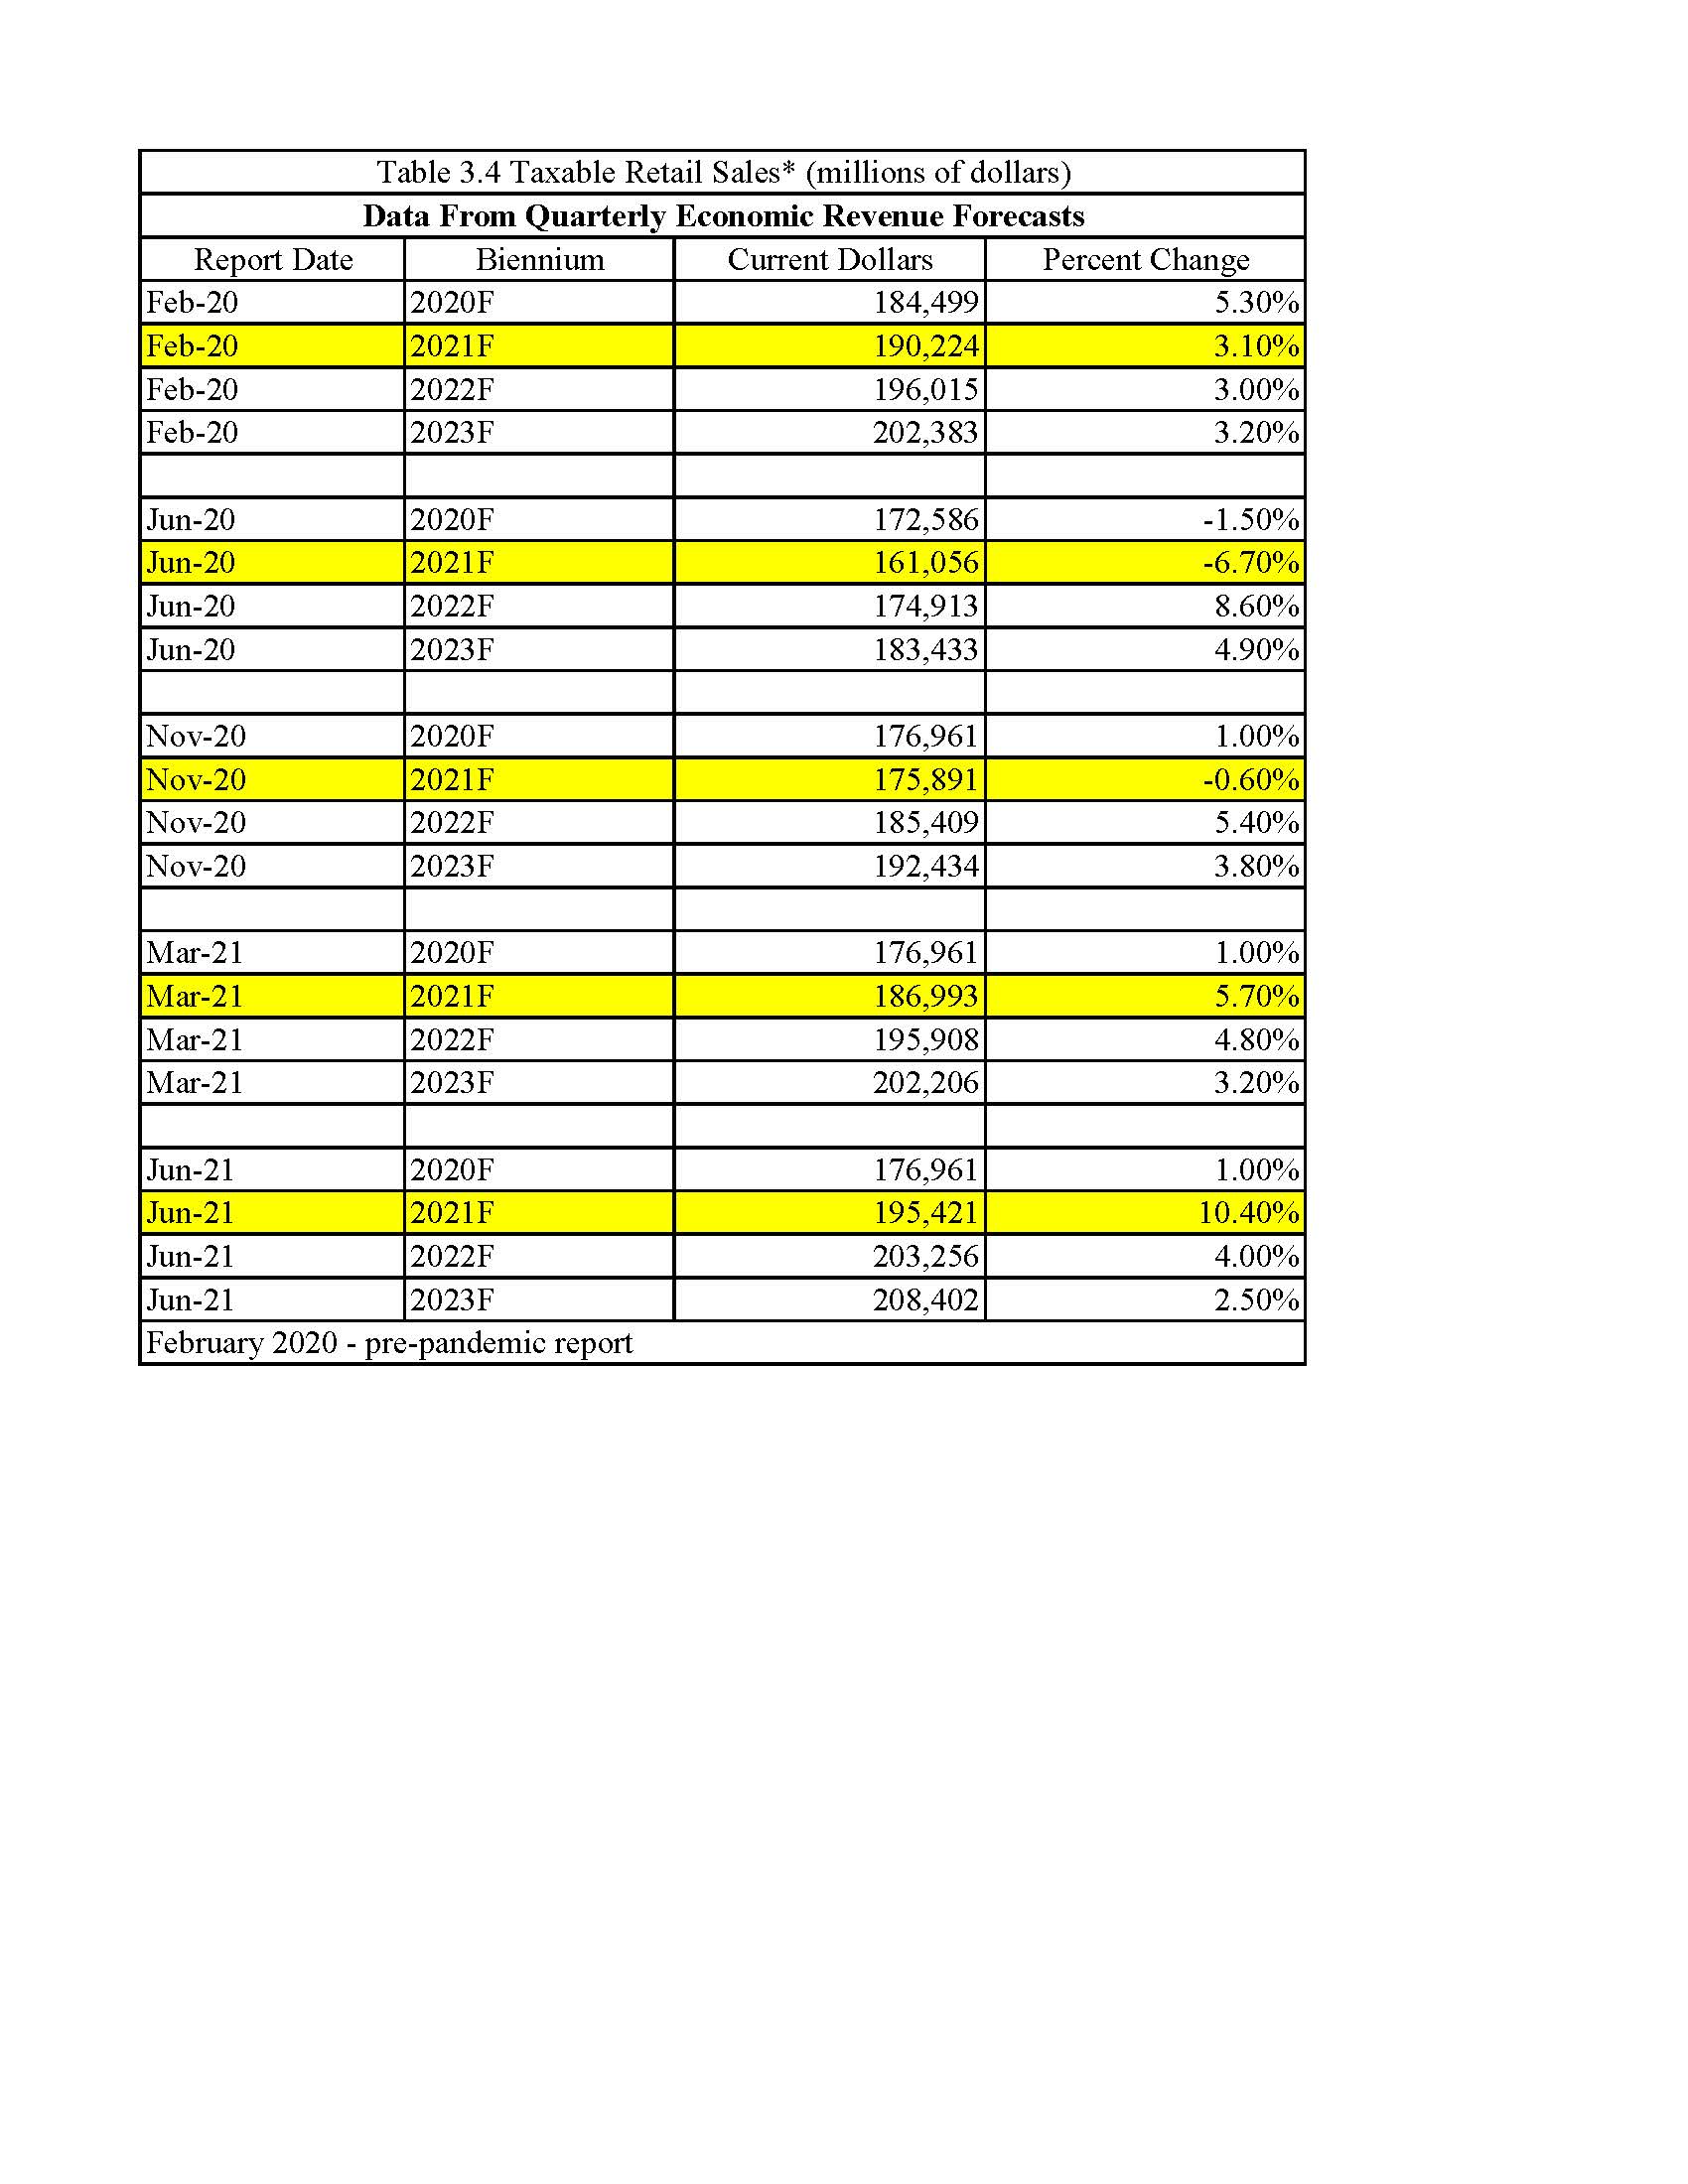
The Washington ERFC reports review new economic and revenue statistics in light of the prior forecast. How did the forecast hold up? Below is a chart showing the forecast progression for Taxable Retail Sales taken from the ERFC reports with the 2021 forecasts highlighted. The dismal June 2020 figure of negative 6.7% has been revised to a positive 5.7% in the March 2021 forecast:

The economic forecast in March 2021 increased the projected Gross Domestic Product (GDP) growth in 2021 to 5.7%, up from 4% in their November 2020 report, and included higher personal income and housing projections.
In the same manner, State General Fund Revenue collections came in higher than forecasted: In September 2020 – 963 million above June forecast, in November 2020 – 380 million above the September forecast and the March 2021 764 million (9.4%) above the November forecast! This was due to multiple factors including the federal Covid related aid packages and the rise in home values after a brief dip. General Fund State revenue collection forecasts were revised upward by 1.9 billion in the 21-23 biennium and 1.85 billion in the 21-23 biennium.
This trend is continuing as the June monthly report shows 9.2% higher than forecasted General Fund revenue collections. The June report has other positive indicators:
- Washington employment rose 37,300 in the last three months but is 200,000 lower than in February 2020.
- Seattle-area home prices are soaring.
- Major General Fund-State (GF-S) revenue collections for the May 11, 2020 – June 10, 2021 collection period came in $299.1 million (9.2%) higher than forecasted in March.
- Cumulatively, collections are now $644.4 million (9.6%) higher than forecasted.
- Tracked collections grew 33.0% year over year due to last year’s pandemic-related shutdowns. year-over-year growth rates are expected to remain high over the next several collection reports.
The Total Picture is More than Just a Little Bit Positive
In fact, Washington’s economy last year performed as one of the very best if not the best in the nation. Of course, that’s important but it’s really important to think of that fact in the context of ARP funds. Since the vast majority of Washington cities and counties ended the fiscal year in the black — and continue to add to surpluses in 2021 — the ARP funds for most of our State is a sort of “windfall.” Most Washington public entities are coming out of the pandemic better than then went into it.
All together, the economy is quite good and the moment. But the fiscal condition of local governments is even better. The ARP funding is getting released in two segments — half this summer and half in the summer of 2022. There’s little doubt that some of these funds are needed for local governments to address public health issues that arose during the pandemic. But the ARP also expressly identifies that spending for the first responder — those that worked the front line during the pandemic — should be a priority use of the funds.
We’ve found significant resistance to past and current union proposals for “hazard pay.” Very few local governments have agreed to extend hazard pay to their first responders. But with the vibrant economy, unexpected growth in tax revenues, and the ARP “windfall,” most cities and counties should come to the table in a position to make realistic wage offers. These developments, along with the unexpected CPI spike in inflation, all suggest that the settlement trends for 2022 will rise quite a bit over the trend of the past few years.
If you are a client or Premium Website subscriber, you should be able to access the linked resources on the Premium Website. If you are unable to access them, please contact Carly Alcombrack at calcombrack@clinelawfirm.com. For others, follow the path to information on how to subscribe.


