By Jim Cline and Kate Kremer
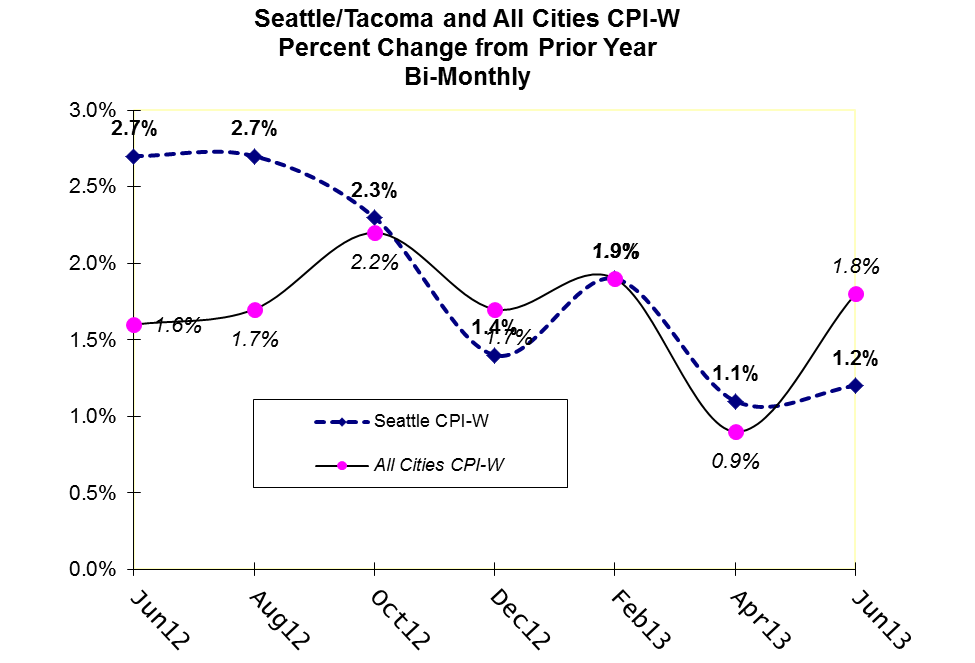
The just-released June CPI numbers show that inflation continues to be low. The Seattle CPI-W index came in at 1.2% up 1/10 of a percentage from April but down from 2.7% from last June. The All-Cities index came in at 1.8%, up from 0.9 in April and slightly up from last June’s 1.6%. This graph shows the movement over the past year.
Historically, over the past 20 years, inflation is around 3%. More recently, 2% inflation seems to reflect the “new normal.” Most recent economic forecasts predict 2% inflation in the next two to three years.
The June CPI report is the report we most closely watch and wait for because among all CPI reports, it is the most significant predictor of bargaining trends for the following year. While parties are using CPI formulas on a decreasing basis in recent negotiations, for public safety labor contracts that do utilize an index, the June numbers are the most frequently used. The June numbers are released just as summer negotiations get underway.
In the historic past, the CPI data has been highly predictive of settlement trends. In the more recent past, that has not been the case. Since the outset of the great recession, the CPI numbers have been unusually volatile and unpredictable, and local economic and fiscal conditions have more strongly influenced bargaining results.
We think that trend will continue into 2014. Despite the low Seattle CPI 1.2% number, we think other developments will be pushing settlements near or above 2%. Recent economic growth and rebounding sales tax revenues, something we’ll write about in our next economic blog article, cause us to be more optimistic about settlement trends than we have been since the 2008 start of the recession. Improving fiscal conditions not only increase available settlement funds, it will also likely lead to a resumption of hiring which, in turn, will start to press employers to offer and maintain a more competitive wage posture than they were required to do during recent hiring freeze periods.
The Seattle and All-Cities “W” indices are the most commonly used, but other labor contacts will turn to other regional formulas. This table lists CPI data used for other Washington contracts:
| CPI INDEX* | CPI-W | CPI-U |
| All-Cities (Jun 2013) |
1.8% |
1.8% |
| Seattle (Jun 2013) |
1.2% |
1.4% |
| West Coast (Jun 2013) |
1.4% |
1.5% |
| West Coast-Class B/C (Jun 2013) |
0.8% |
1.0% |
| Portland -Salem (Second Half 2012) |
1.8% |
2.1% |
With a modest economic recovery underway and recent revenue reports surpassing earlier predictions, we think the trend line is pointing up. We’ll be bringing you some more articles in the time ahead delving into these economic and fiscal developments.


