By Jim Cline and Kate Kremer
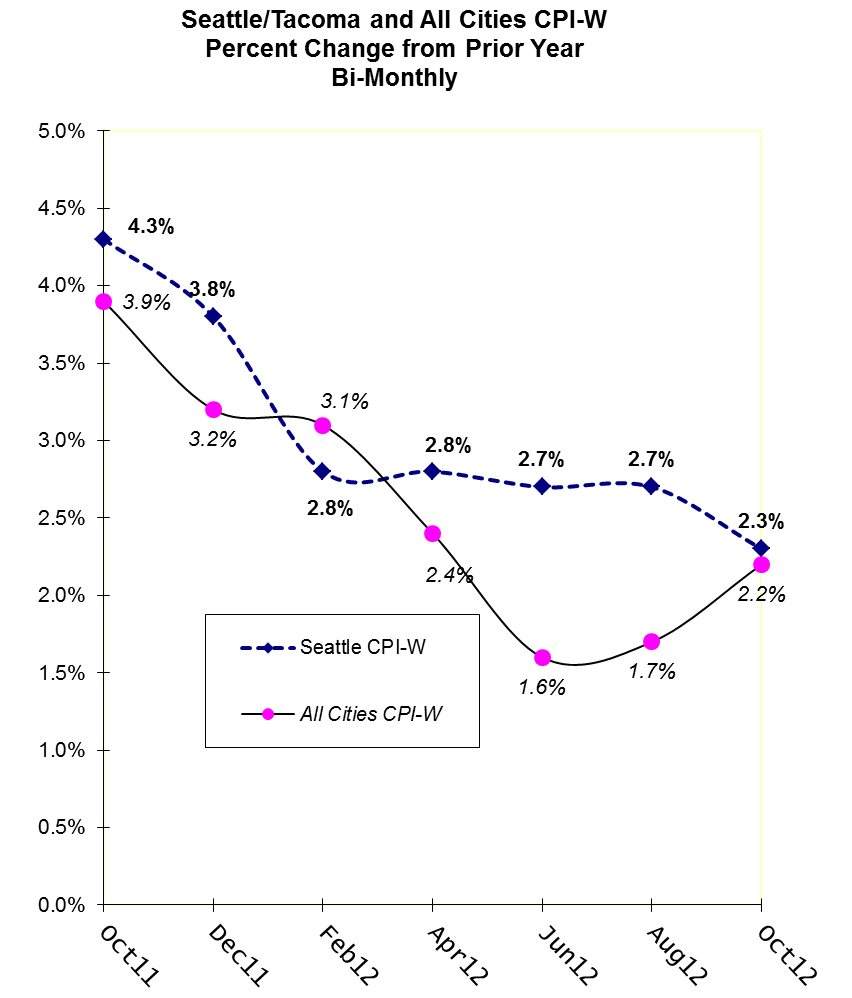
In our last inflation report, the August bimonthly Seattle-W CPI index was a full percentage point above the All Cities-W (2.7% versus 1.7%). However, the latest bimonthly CPI release shows a convergence of the two indices. The October Seattle W has dropped to 2.3% while the All Cities-W has risen to 2.2%:
The National index spiked up in September, following a rise in energy prices but overall inflation was more subdued in October, rising only .1%. The downward draft in the Seattle index is not entirely unexpected. In a previous article, we discussed projections by economists for near term inflation in the range of 2%.
The various inflation indices can be anticipated to ebb and flow, but we continue to adhere to our past prediction that the Seattle index will outperform the national index, at least in the near term. For charts showing the historic relationship between the Seattle and All Cities CPI indices, visit our premium website.
Here’s is a tableof other CPI indices sometimes used in state contracts:
| CPI INDEX* | CPI-W | CPI-U |
| All-Cities (Oct 2012) |
2.2% |
2.2% |
| Seattle (Oct 2012) |
2.3% |
2.3% |
| West Coast (Oct 2012) |
2.5% |
2.5% |
| West Coast-Class B/C (Oct 2012) |
1.5% |
1.6% |
| Portland -Salem (First Half 2012) |
2.2% |
2.5% |
While the Portland mid-year inflation report is near the Seattle index, the West Coast B/C index lags behind.
The 2012 year-end CPI will be released in mid-February and at that time, we will report on those figures. In some upcoming articles, we will discuss 2012 and 2013 wage settlement trends and discuss how the CPI index is expected to impact those trends.


