August 3, 2025
By Jim Cline and Kate Kremer
Of all the monthly and bimonthly inflation reports, the June report is the one most impactful on Washington public safety labor negotiations. Many multi-year contracts use a CPI formula tied to the June numbers and for those not tied to an agreed formula, the June numbers are the ones most often cited in negotiations as the basis for the floor of wage increases.
Filed Under: CPI, Economic Developments, Economics
April 10, 2025
By Jim Cline
This morning’s monthly All Cities CPI report showed an inflation slowdown. But as it impacts labor negotiations, this development is dwarfed against the larger backdrop of economic and fiscal uncertainty.
Filed Under: CPI, Economic Developments, Economics
March 27, 2025
By Jim Cline
In Monday’s newsletter, we reported on the last All-Cities and Seattle CPI from February. That report showed that the Seattle indices, which had been running a percentage point or two over the All-Cities number are now coinciding with the All-Cities numbers and actually a fraction of a percent lower. This raises a recurring question on the differences between these indices and the pros and cons of each.
Filed Under: CPI, Economic Developments, Economics
March 26, 2025
By Jim Cline
In our last newsletter, we discussed the February CPI Report. In this article we discuss other economic developments, including state and local revenue forecasts.
Filed Under: CPI, Economic Developments, Economics
March 24, 2025
By Jim Cline
The Bureau of Labor Statistics released their bimonthly inflation report March 12 showing inflation through February. Most economists had projected that All Cities CPI would be around the 3.0% mark reported in the January inflation report but instead a slight dip was reported. Another notable trend is that, as we have been anticipating, the Seattle indices have continued to slow, and Seattle area inflation is reported as slightly less than national numbers.
Filed Under: CPI, Economic Developments, Economics
December 3, 2024
By Jim Cline and Kate Kremer
The latest CPI data shows a continued easing in inflation. The period of higher inflation of the past few years seems to be ending at least for now. And the large gap that had existed between the City and All Cities CPI also seems to be closing.
August 29, 2024
By Jim Cline and Kate Kremer
In the last couple of articles, we discussed the recent BLS June CPI data and why the June CPI numbers have outsized importance. In this article we discuss the so-called “Seattle” CPI index. There’s often confusion about exactly what the “Seattle” CPI index is and how it impacts negotiations around the State. We’ll address those questions today.
August 1, 2024
By Jim Cline and Kate Kremer
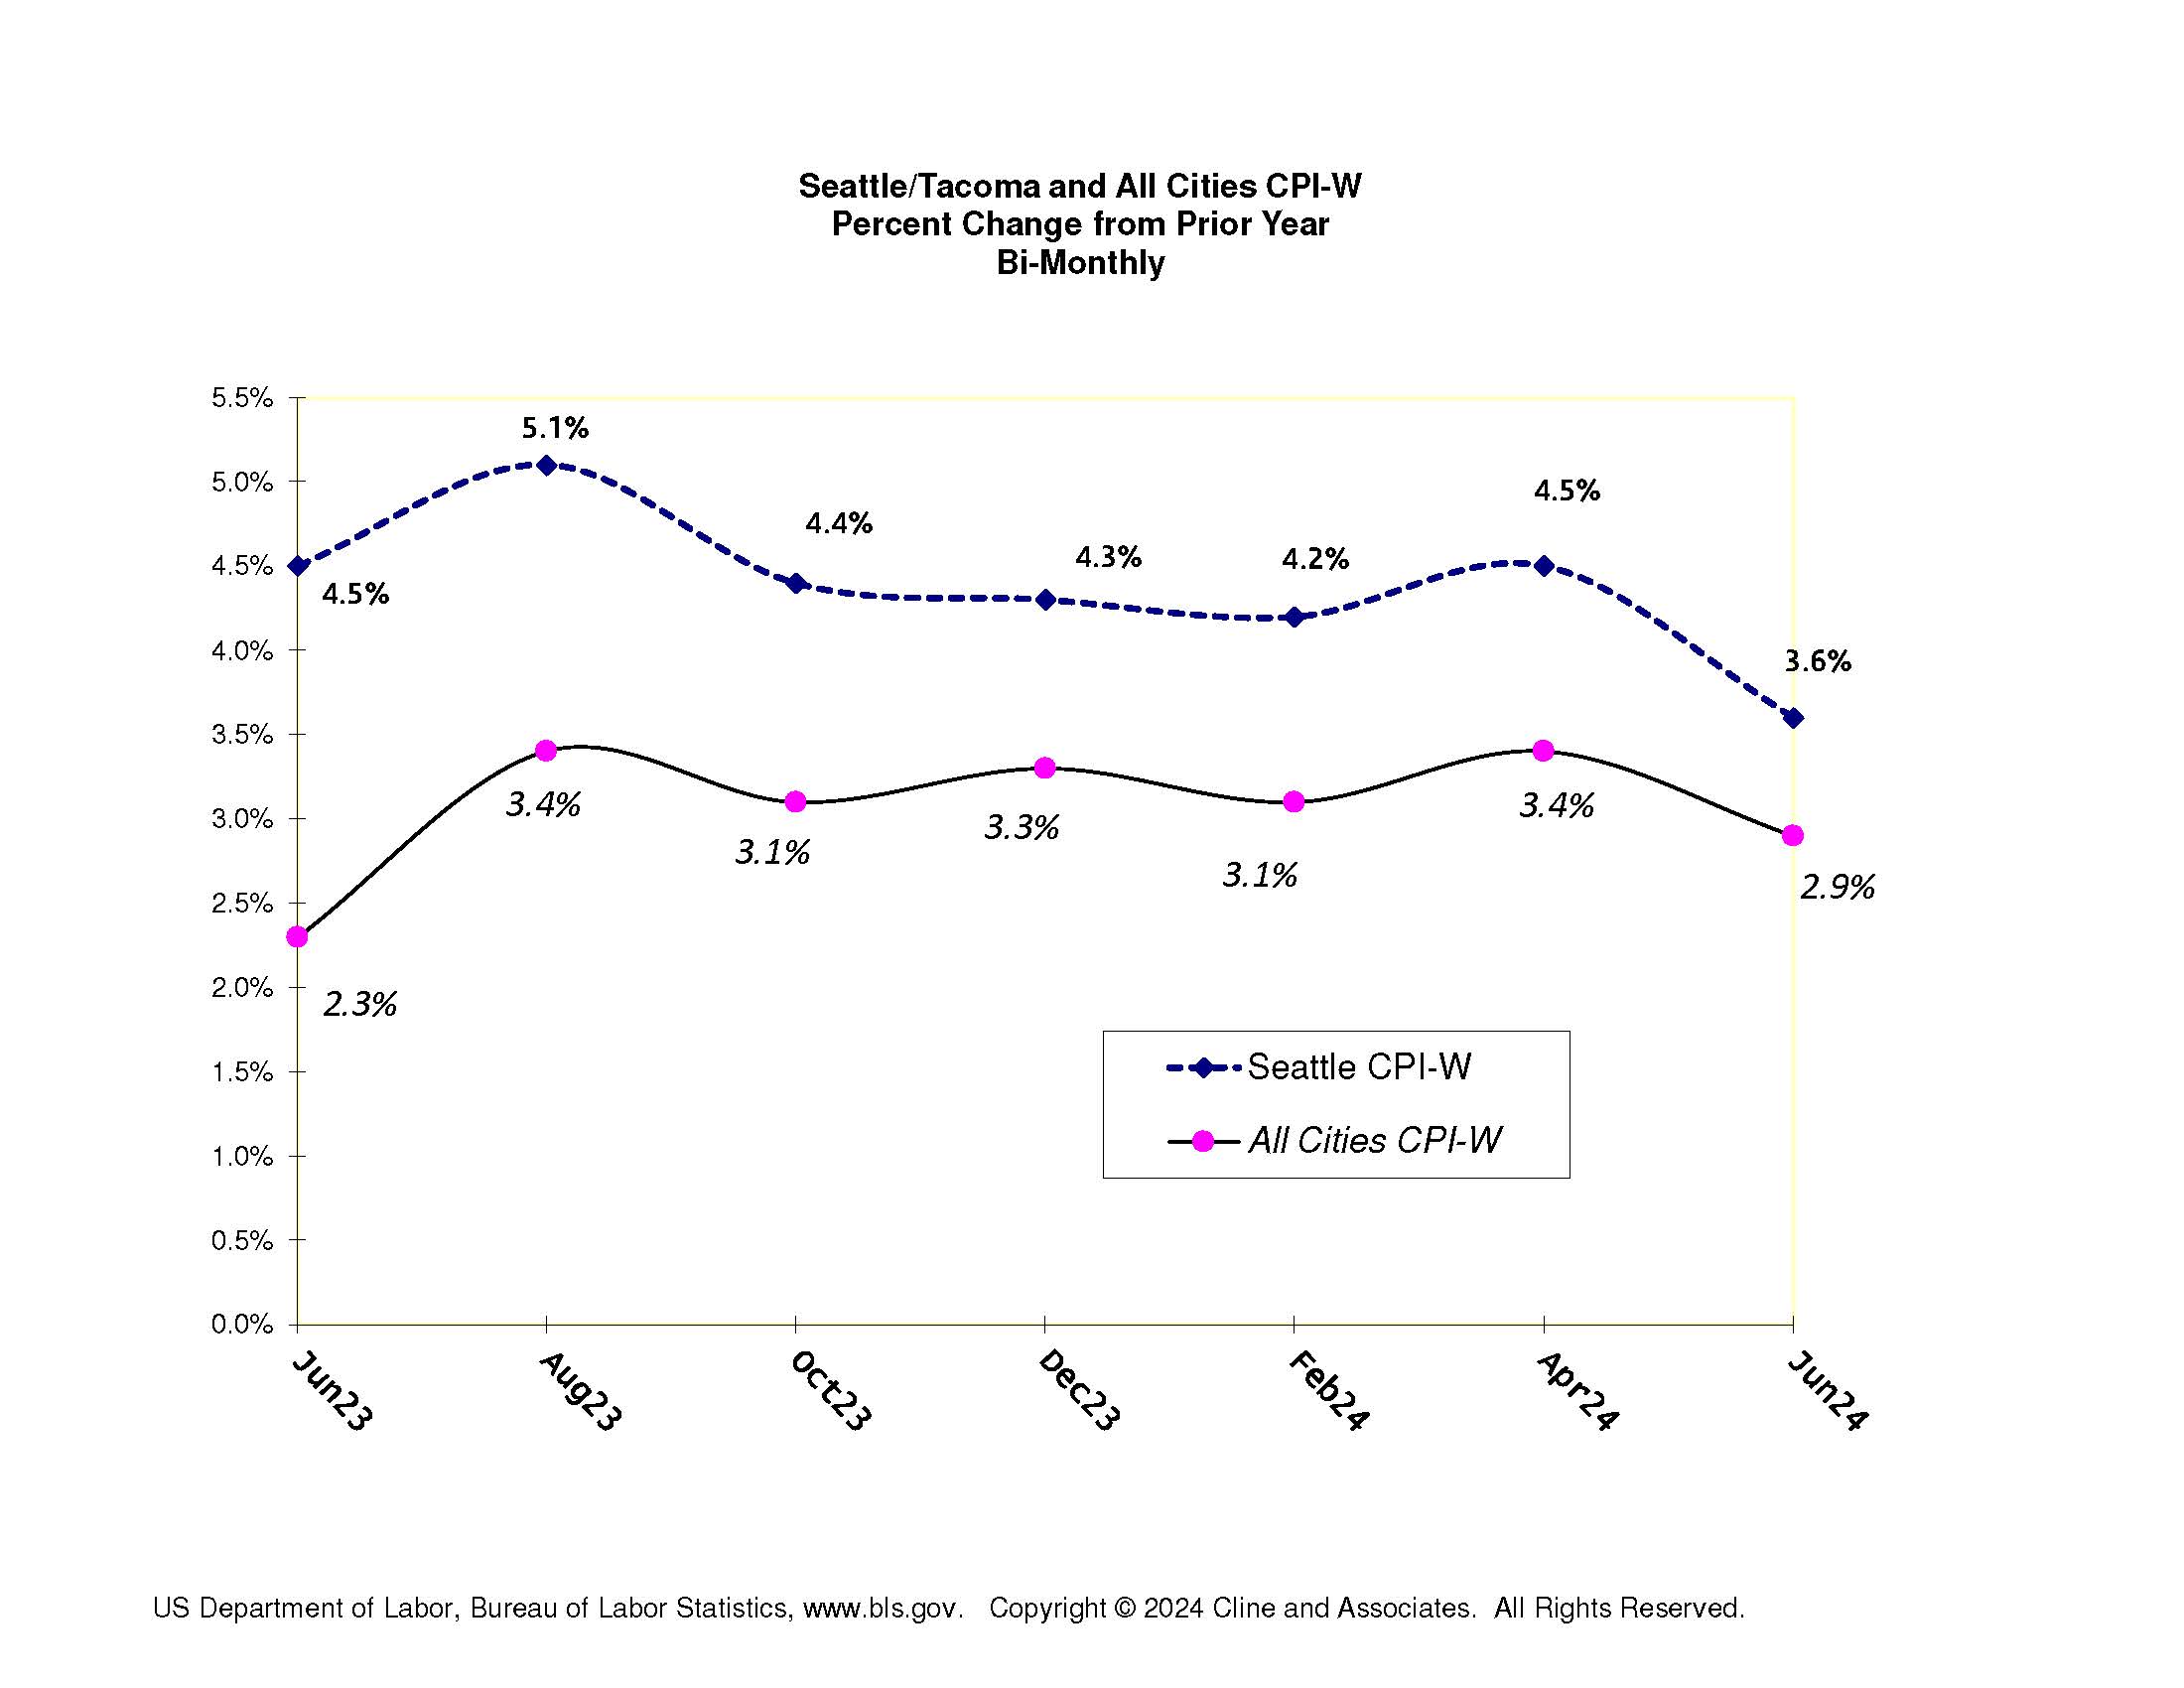
In our last newsletter we discussed the most recent inflation report from CPI. It shows the All-Cities “W” index inflation had decelerated to 2.9% and the corresponding Seattle inflation index had dropped to 3.6 (down from 4.5% just in April). The less commonly relied upon Seattle “U” index was notch higher at 3.8%. Other West Coast indices were close in line with the All-Cities numbers.
Filed Under: CPI, Economic Developments, Economics
July 30, 2024
By Jim Cline and Kate Kremer
The Bureau of Labor Statistics released their bimonthly inflation report two weeks ago showing inflation through June. We have previously reported on the slowdown of inflation with predictions of further slowdown ahead. This report confirms that expected trend. Most notable about the June report is that anticipated cooling of the “Seattle” numbers is materializing.
Filed Under: CPI, Economic Developments, Economics
May 1, 2024
By Jim Cline
In our recent newsletters we discussed the extension of arbitration to emergency dispatchers (Newsletter 4/26/24). In the last article, we discussed what the chief interest arbitration factors were under law and arbitration precedent (Newsletter 4/29/24). We noted in that article that there may be some complexities in extending those principles to dispatchers and we discuss that here.


